The Fed tipped its hand today, and unveiled its "viral reaction function" revealing the timetable according to which the Fed will start talking about QE tapering.
As discussed previously, James Bullard, president of the St. Louis Federal Reserve, said in an interview with Bloomberg Television that getting 75% of Americans vaccinated would be a signal that the pandemic was ending, which is a necessary condition for the central bank to consider tapering its bond-buying program. According to our calculations, extrapolating current vaccination rates would mean that - all else equal - we could see the Fed's 75% bogey be hit in just two short months.
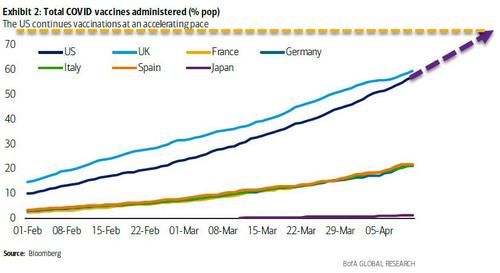
As we further said, one thing Powell did not want to do is give any calendar estimation as to when the Fed could start "thinking about thinking" about tapering. Well, thanks to Bullard, it may have no choice but to do so as soon as the summer. And what's worse, now that the market is aware of the Fed's "viral reaction function", any sharp jump in the vaccination rate will provoke risk off moves as traders start pricing in the inevitable tapering of QE which they now know will be catalyzed by a "normalization" in the pandemic.
A subsequent calculation by Bloomberg came up with a slightly later D-day: as Bloomberg commentator Ye Xie wrote, "at the current rate of inoculation, that threshold could be met by early August, just before the Fed's Jackson Hole Symposium, a venue known for major policy announcements."
So assuming the Fed gives markets a couple of months to prepare for the move, the actual tapering could start early next year. That time frame is roughly in line with the median forecast in the Fed's survey of primary dealers, even though market pricing suggests a more aggressive timetable.
Meanwhile, as we also laid out last week, China's stimulus tapering is already under way, with Bloomberg pointing out that "the year-on-year growth of total social financing fell to 12.3% in March, from 13.3% in February and a peak of 13.7% in October. At this rate, the credit impulse, or the change of new credit as a percentage of GDP, could start to shrink by July or August -- just as the Fed may lay the groundwork for its own tapering."
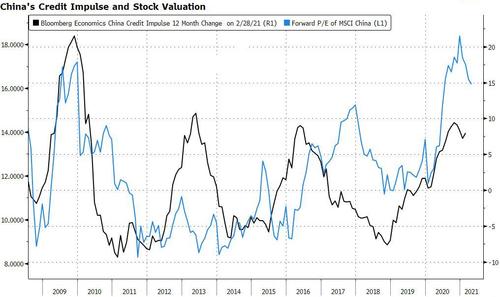
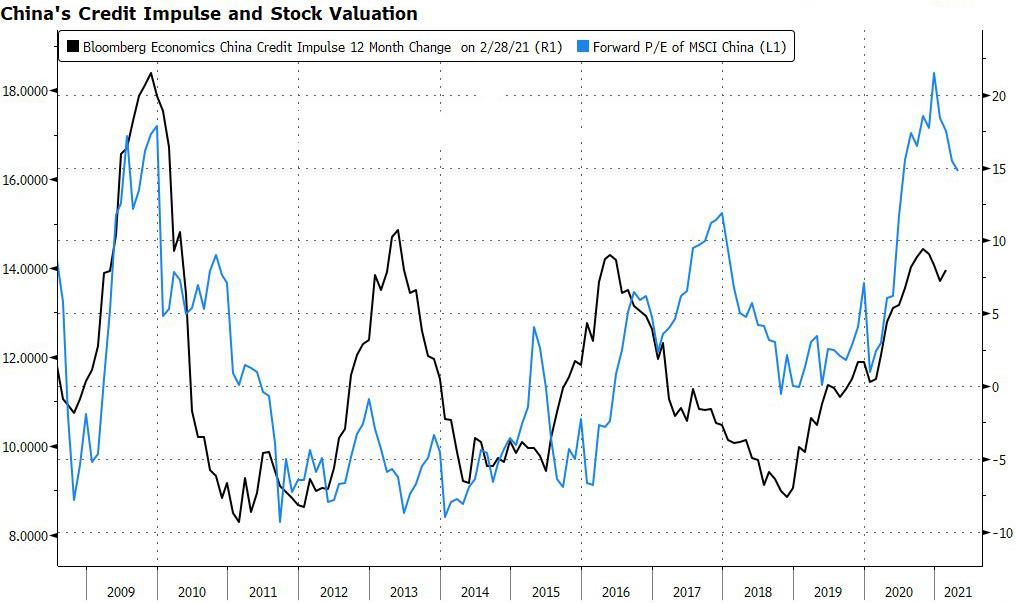
So, as Bloomberg's Xie concludes, "from a liquidity perspective, the summer could be a challenging time for markets. In the past decade, the slowdown of China's credit impulse has consistently been accompanied by investors cutting the valuation of the MSCI China Index."
But it's not just Chinese stocks that are subject to the monthly injections and drains of the all-important credit impulse: As a reminder, the credit impulse first reaches assets that are driven primarily by the Chinese economy (Chinese bond yields and industrial metals). Next to be impacted are inflation breakevens and sovereign yields in Western economies. The peak correlation for other growth-sensitive assets such as eurozone banks and AUD/JPY arrives with bigger lag of around 4-5 quarters. This result, while logical, is quite significant, as it gives us a playbook for the ebb and flow in Chinese credit impulse.
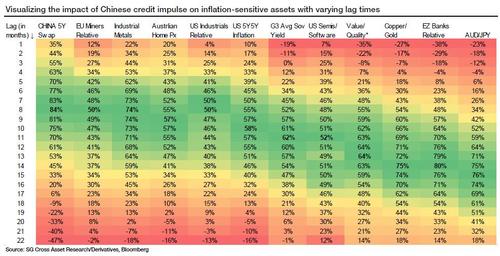
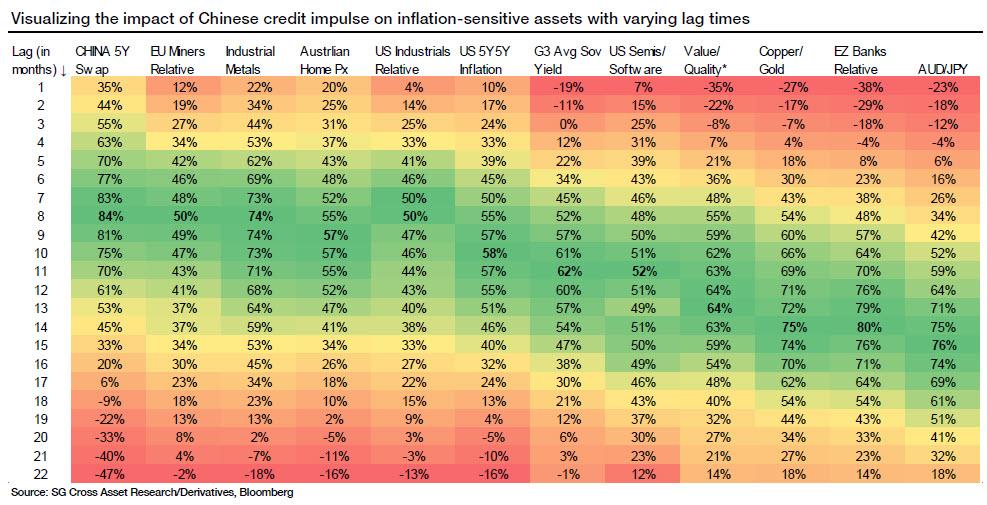
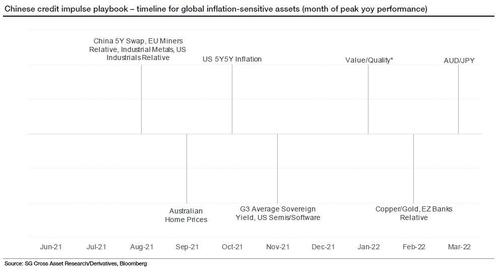
In the chart below, SocGen provides a critical estimated timeline of the peak Y/Y performance for each of the assets it sees as impacted by China's credit impulse slowdown. While these assets are influenced by multiple factors and therefore could easily diverge from expectations, the chart below does present a neat output from a lagged regression analysis and is a useful guideline for the balance of this year and next.
Commenti
Posta un commento