Passa ai contenuti principali

This Simple Chart Reveals The Distribution Of Global Wealth

The pandemic resulted in global wealth taking a significant dip in the first part of 2020. By the end of March, global household wealth had already declined by around 4.4%.

However, as Visual Capitalist's Anshool Deshmukh details below, after much monetary and fiscal stimulus from governments around the world, global household wealth was more than able to recover, finishing up the year at $418.3 trillion, a 7.4% gain from the previous year.

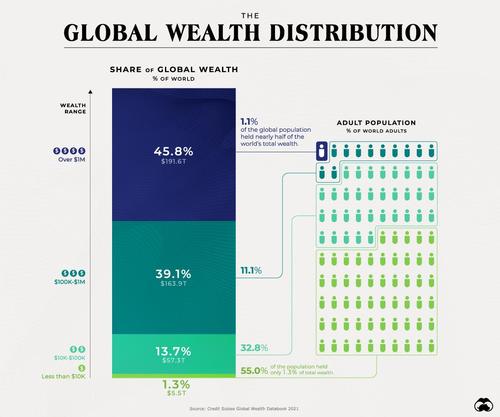
Using data from Credit Suisse, this graphic looks at how global wealth is distributed among the adult population.

How is Global Wealth Distributed?

While individuals worth more than $1 million constitute just 1.1% of the world's population, they hold 45.8% of global wealth.

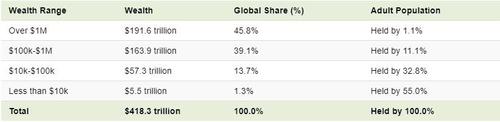
On the other end of the spectrum, 55% of the population owns only 1.3% of global wealth.

And between these two extreme wealth distribution cases, the rest of the world's population has a combined 52.8% of the wealth.

Global Wealth Distribution by Region

While wealth inequality is especially evident within the wealth ranges mentioned above, these differences can also be seen on a more regional basis between countries.

In 2020, total wealth rose by $12.4 trillion in North America and $9.2 trillion in Europe. These two regions accounted for the bulk of the wealth gains, with China adding another $4.2 trillion and the Asia-Pacific region (excluding China and India) another $4.7 trillion.

Here is a breakdown of global wealth distribution by region:

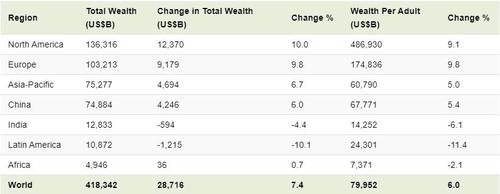
Total wealth fell in India by $594 billion, or 4.4%. Meanwhile, Latin America appears to have been the worst-performing region, with total wealth dropping by 11.4% or $1.2 trillion.

Post-COVID Global Outlook 2020-2025

Despite the burden of COVID-19 on the global economy, the world can expect robust GDP growth in the coming years, especially in 2021. The latest estimates by the International Monetary Fund in April 2021 suggest that global GDP in 2021 will total $100.1 trillion in nominal terms, up by 4.1% compared to last year.

The link in normal times between GDP growth and household wealth growth, combined with the expected rapid return of economic activity to its pre-pandemic levels, suggests that global wealth could grow again at a fast pace. According to Credit Suisse estimates, global wealth may rise by 39% over the next five years.

Low and middle-income countries will also play an essential role in the coming year. They are responsible for 42% of the growth, even though they account for just 33% of current wealth.

Commenti

Post popolari in questo blog

Charting the World Economy: The U.S. Jobs Market Is On Fire - Bloomberg

Charting the World Economy: The U.S. Jobs Market Is On Fire - Bloomberg https://www.bloomberg.com/news/articles/2019-12-06/charting-the-world-economy-the-u-s-jobs-market-is-on-fire Charting the World Economy: The U.S. Jobs Market Is On Fire Zoe Schneeweiss Explore what's moving the global economy in the new season of the Stephanomics podcast. Subscribe via  Apple Podcast , Spotify or  Pocket Cast . The last U.S. payrolls report of the decade was a doozy, beating expectations and doing its bit to keep the consumer in good health heading into 2020. That's good news given the various pressures still weighing on global growth. Here's some of the charts that appeared on Bloomberg this week, offering a pictorial insight into the latest developments in the global economy. U.S. Advertisement Scroll to continue with content ...

Another Paradox: Consumer Spending Expectations Surge, Despite Dismal Income, Earnings

Call it the latest economic paradox. Despite widespread stories of doom and gloom about the state of US consumer finances once the fiscal stimulus bill expires on Dec 31, the latest NY Fed survey of consumer expectations unexpectedly shows that US consumers have little intention of slowing down their spending. In fact, and very paradoxically,  despite depressed and flat income and earnings growth expectations,  with median one-year ahead expected earnings growth at 2.0% for fifth consecutive month and expected income growth barely little changed at 2.14% ... ...  consumers' 1-year ahead  spending growth expectations  jumped to 3.73% over the next 12 months in November  - the highest level in more than four years, not only up from the 3.06% in the previous month but a whopping 33% more than the 2.8% reported last November,  making this the biggest Y/Y increase in expected spending in series history. This bizarre increase took place even as labor market signals were mixed: although t...

China Exports, Imports Fall Sequentially, Adding To Slowdown Fears

China's exports rose 19.3% y/y in July, missing the median consensus expectation of 20% (ranging from 15.4% to 30.7%), and declining sequentially -0.3% in July after rising +5.7% in June. Imports also rose less than expected, up 28.1% Y/Y in July, below the 33.3% median expectation, and fell 6.4% sequentially after surging +11.3% M/M in June. As a result this disproportional slowdown in imports vs exports, China's monthly trade surplus actually rose to $56.6bn in July, slightly better than the $53.3BN consensus, and up from $51.5BN in June due to the bigger miss in imports. ASEAN was China's biggest trading partner in July, followed by the Europe Union and the U.S., customs data showed. China's exports to the US grew 13.4% in July from a year ago, while imports from America rose 25.6%, leaving a trade surplus of $35.4 billion in the month. Some more details: By geography:  Export growth slowed across major export destinations, and exports to major DMs continued to be a ...