BIGGEST WITHDRAWALS ON RECORD
There is a lot of relevant information in the text below from a Wall Street Journal article dated December 8, 2019:
"Investors have pulled $135.5 billion from U.S. stock-focused mutual funds and exchange-traded funds so far this year, the biggest withdrawals on record, according to data provider Refinitiv Lipper, which tracked the data going back to 1992."
DOES 2019 LOOK ANYTHING LIKE THE MAJOR PEAK IN 2000?
Given we know extreme sentiment can be a powerful contrary indicator, we would expect exuberant investors to rush into stock-based investments near a major stock market peak, which is exactly what happened in the year 2000. From a Federal Reserve Bulletin dated December 2000:
"Mutual fund investors returned vigorously to equity funds, increasing the pace of net new cash flows into those funds to a record level over the first eight months of 2000."
Keep in mind, the S&P 500 peaked in March 2000 and investors were still adding to stock-based funds at a record pace through the end of August 2000, which looks nothing like what we have seen in 2019.
HOW DOES 2019 COMPARE TO OTHER PERIODS?
As shown on December 2, when investors made a mad dash for the equity fund exits, it occurred near major stock market lows in 2002, 2009, 2011, and 2016.

We just experienced heavy equity fund outflows in 2019, similar to the periods shown in the graph above. How did the S&P 500 perform walking forward from December 2002, March 2009, December 2011, and July 2016? The answer is in a manner that looks nothing like a major stock market top.

TEN NEW STOCK MARKET SIGNALS
This week's stock market video covers ten "this just happened in 2019" signals. The video also takes a look at the blow-off top cases cited in a recent CNBC article.
DAY BY DAY
The market still has trade-related hurdles to contend with between now and December 15, reminding us to walk forward with a flexible, unbiased, and open mind. The fund flows data above simply helps us with historical perspective on what has taken place in 2019. From The Wall Street Journal:
"There's not a lot of faith in this market," said Scott Wren, a senior global equity strategist at Wells Fargo Investment Institute. "There's no chasing going on. Usually before you hit the top in a cycle, there's a lot of chasing and fund flows are higher."
WEIGHT OF THE EVIDENCE
Common sense tells us, even in the strongest of strong bull markets, we can find concerning data points and scary narratives. There is always something to be concerned about. Markets move based on the weight of the evidence. Therefore, we are constantly evaluating present-day data points and looking for signals that confirm or contradict the bullish hypothesis that was formed in early January 2019.

THIS JUST HAPPENED
The only way we can really understand if a signal leans bullish, bearish, or neutral is to ask and answer the following question:
How many times has it occurred in the past and how did the stock market perform after past signals?
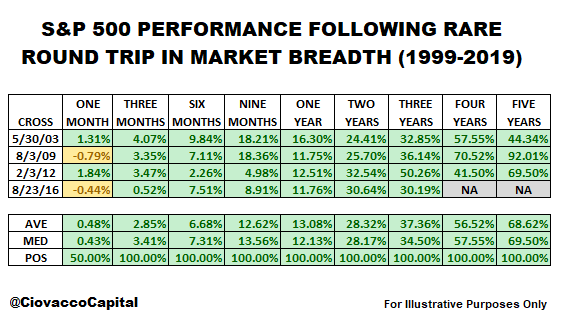
The chart below shows the percentage of S&P 500 stocks above their 200-day exponential moving average. It is rare for this breadth indicator to drop below the blue line, which is indicative of extreme pessimism about future economic and market outcomes. If you know market history, you know most signals that began to form in 2002, 2009, 2011, and 2015 turned out to be great "keep an open mind about better than expected outcomes" signals. The signal shown below is triggered when breadth gets oversold (below the blue line) and then makes it all the way back to the green line. The last round trip took place between late December 2018 and late November 2019.

HOW DID STOCKS PERFORM WALKING FORWARD?
Rather than waiting for something to happen (i.e. market to make a top), the table below is based on something that just happened. In the previous cases, and based on all the data available, subsequent S&P 500 performance was very satisfying looking out three months to five years.
Continuing with the weight of the evidence theme, ten new signals and S&P 500 performance tables are covered in the video below.
DOES THE BLOW-OFF TOP THEORY HOLD WATER?
The hot topic on Wall Street this week was "blow-off top". How concerned should we be about an end to a euphoric stock market rally? You can decide.
REALISTIC EXPECTATIONS
Was it a cake walk after the breadth thrust round trip that was triggered on August 23, 2016? No, reminding us that even under a longer-term bullish scenario, really scary periods are to be expected.

PREVIOUS SIGNALS ALIGN WITH SIGNALS ABOVE
The Seeking Alpha posts below provide additional support for the longer-term bullish case:
DAY BY DAY
We will continue to test the cyclical low (December 2018) in the context of a secular trend thesis in upcoming posts and videos. If the weight of the evidence begins to shift in a bearish manner, we must be willing to adjust our assessment of the probabilities.
Commenti
Posta un commento