In our ongoing attempts to glean some objective insight into what is actually happening "on the ground" in the notoriously opaque China, whose economy has been hammered by the Coronavirus epidemic, lst week were stressed out several "alternative" economic indicators such as real-time measurements of air pollution (a proxy for industrial output), daily coal consumption (a proxy for electricity usage and manufacturing) and traffic congestion levels (a proxy for commerce and mobility), before concluding that China's economy appears to have ground to a halt.
That conclusion was cemented after looking at some other real-time charts which suggest that there is a very high probability that China's GDP in Q1 will not only flatline, but crater deep in the red for one simple reason: there is no economic activity taking place whatsoever.
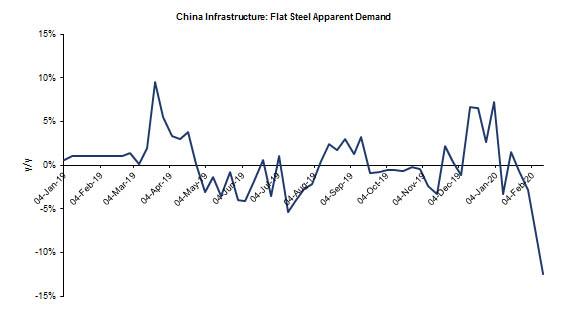
We start with China's infrastructure and fixed asset investment, which until recently accounted for the bulk of Chinese GDP. As Goldman writes in an overnight report, in the Feb 7-13 week, steel apparent demand is down a whopping 40%, but that's only because flat steel is down "only" 12% Y/Y as some car plants have ordered their employee to return to work (likely against their will as the epidemic still rages).
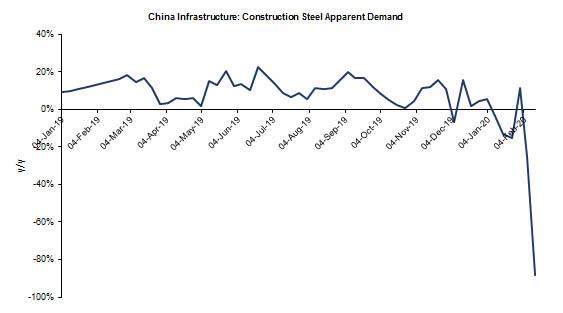
However, it is the far more important - for China's GDP - construction steel sector where apparent demand has literally hit the bottom of the chart, down an unprecedented 88% Y/Y or as Goldman puts it, "construction steel demand is approaching zero."
But wait, there's more.
Courtesy of Capital Economics, which has compiled a handy breakdown of real-time China indicators, we can see the full extent of just how pervasive the crash in China's economy has been, starting with familiar indicator, the average road congestion across 100 Chinese cities, which has collapsed into the New Year and has since failed to rebound.
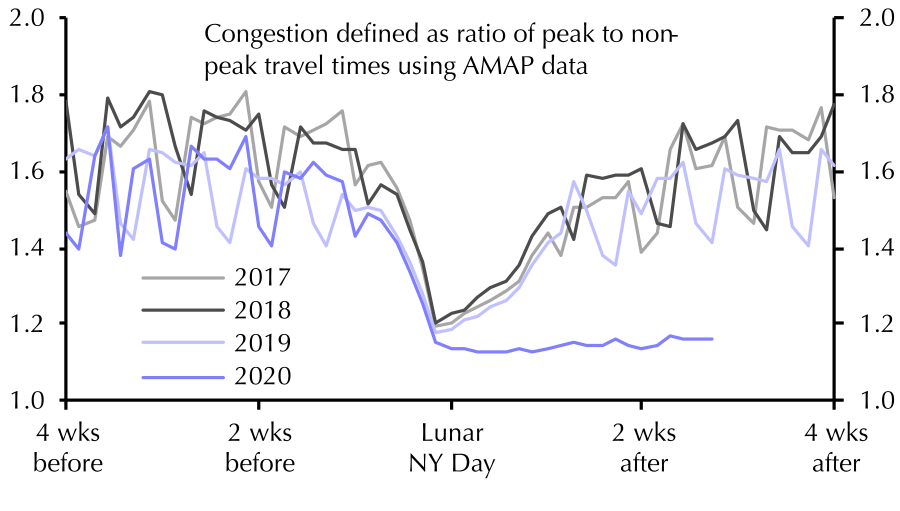 Average Road Congestion across 100 Cities in China
Parallel to this, daily passenger traffic has also flatlined since the New Year and has yet to post an even modest rebound.
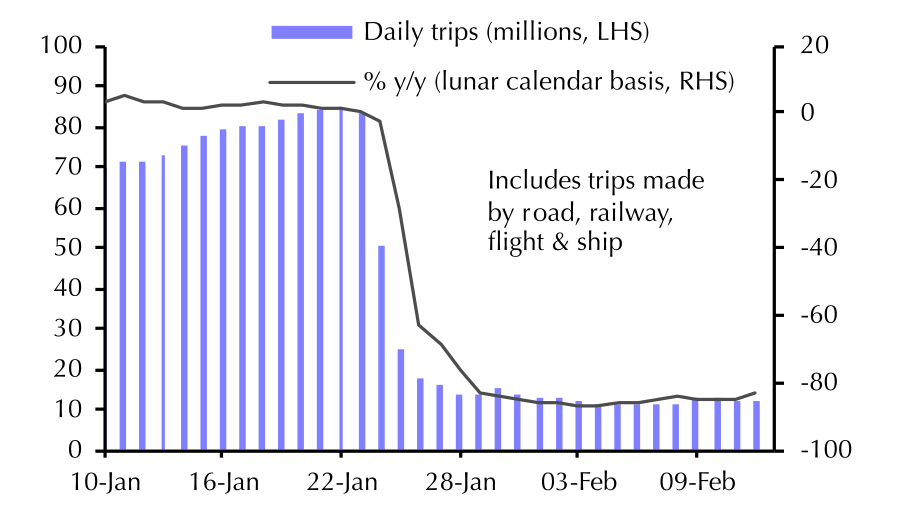 Daily Passenger Traffic
And the biggest shocker: a total collapse in passenger traffic (measured in person-km y/y % change), largely due to the quarantine that has been imposed on hundreds of millions of Chinese citizens.
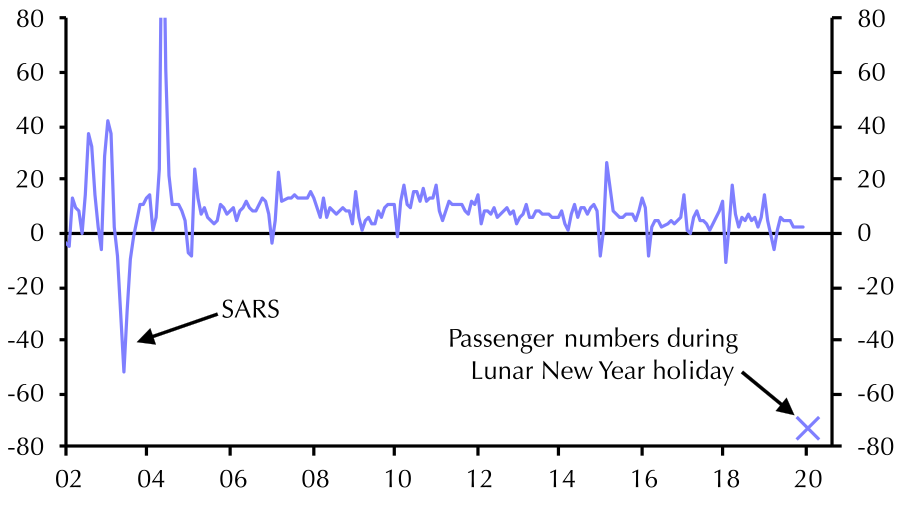 Passenger Traffic (person-km, % y/y)
And while we already noted the plunge in coal consumption in power plants as Chinese electricity use has cratered...
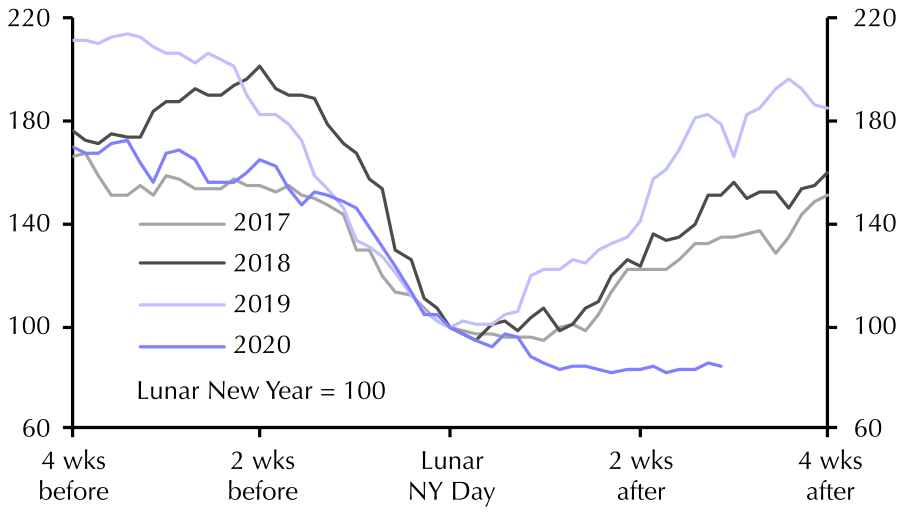
Coal Consumption at Power Plants
... what is perhaps most striking, is the devastation facing the Chinese real estate sector where property sales across 30 major cities have basically frozen.
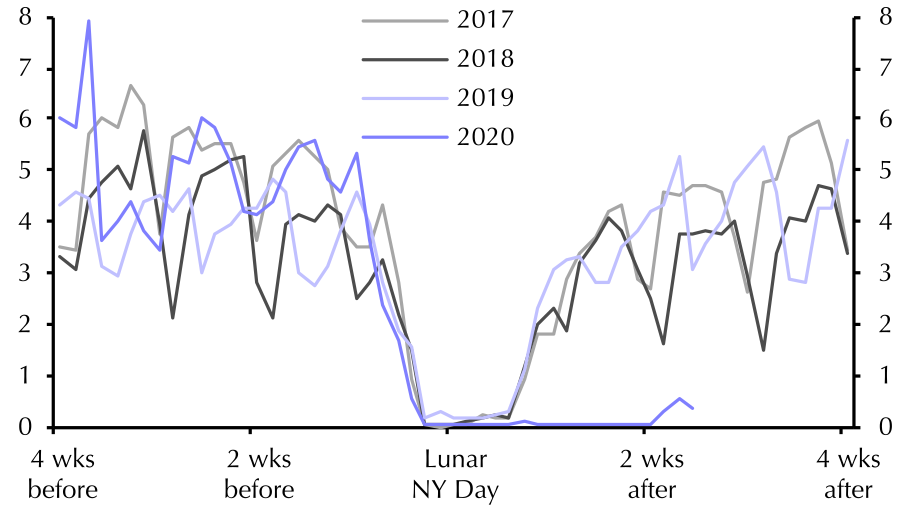
Daily Property Sales in 30 Major Cities (Thousand Units)
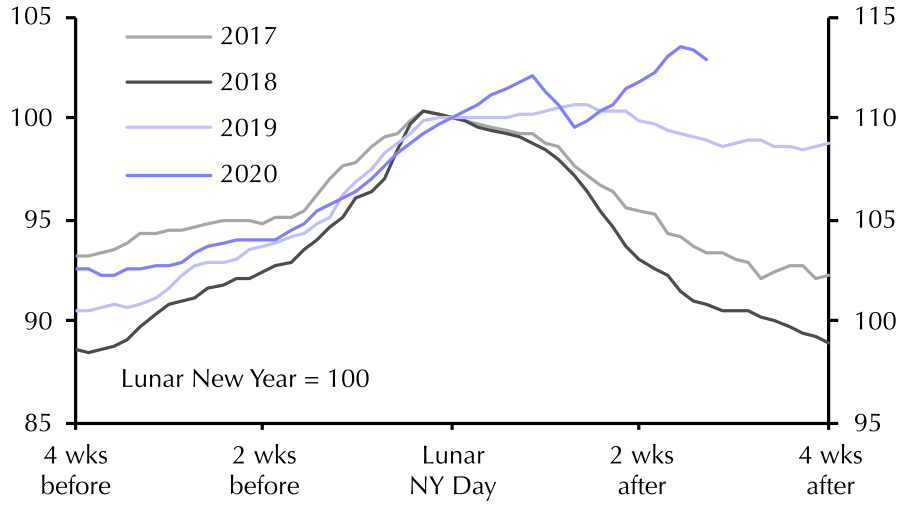
Food Wholesale Price Index
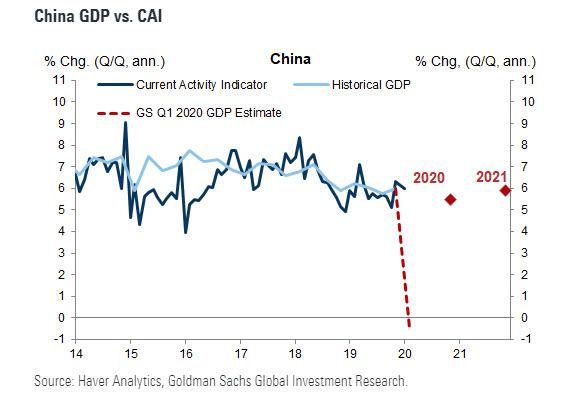
... which in a nation of 1.4 billion is a catastrophic mix. As the coronavirus pandemic spreads further without containment, and as the charts above continue to flatline, so will China's economy, which means that not only is Goldman's draconian view of what happens to Q1 GDP likely optimistic as China now faces an outright plunge in Q1 GDP...
... but any the expectation for a V-shaped recovery in Q2 and onward have some possibility to vaporize faster than a vial of ultra-biohazardaous viruses in a Wuhan virology lab.
Commenti
Posta un commento