When it comes to investing in safe assets such as US Treasuries, the decision process is relatively simple: one buys coupon securities (with a maturity over 1 year), on specific expectations of inflation (or deflation) and receiving current income in the form of a cash coupon (assuming there is one). When it comes to T-Bills the decision is simpler: it's all about liquidity preference - does one keep cash equivalents in the form of US Dollars, whether paper or electronic, or does one purchase Bills, with a maturity from 4- to 52-weeks. If investors are mostly happy to exchange money for Bills, it is generally said that liquidity in the financial system is ample; if however investors are unwilling to part with their "cash" in order to fund the US Treasury (as a reminder, in a time of chronic budget deficits, Uncle Sam has to issue debt to fund its operations), then there is a liquidity shortage.
We bring this up because last week we warned that as the Treasury scrambles to rebuild its cash balance to roughly $350BN from the latest $133BN in Treasury cash, a process that will require the aggressive gross and net issuance of T-Bills, liquidity in the system was set to collapse.
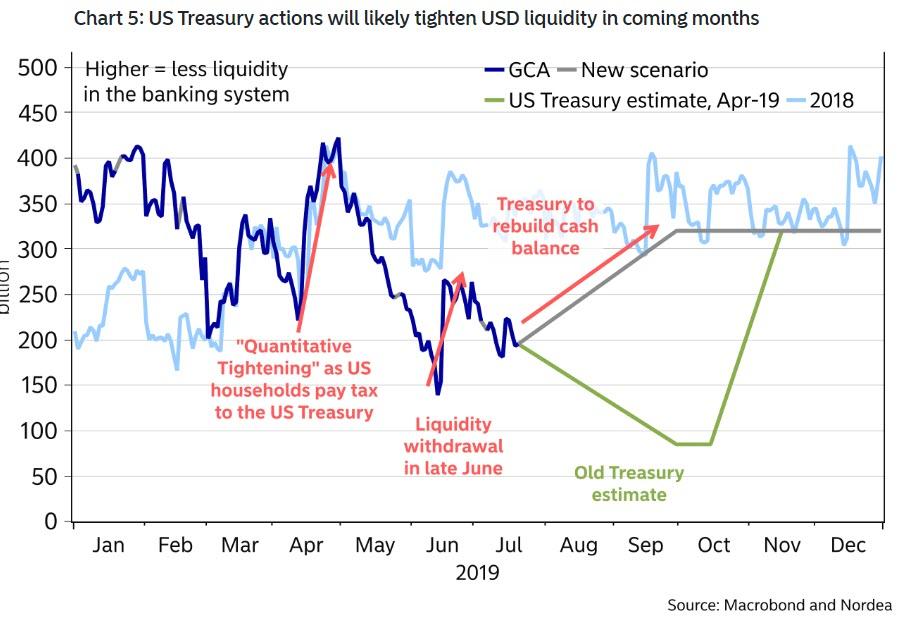
In fact, according to Bank of America the liquidity shortage over the next two months - a period in which as shown in the chart above the Treasury would aggressively be issuing bills - would be so acute, that the Fed may be forced to launch QE, a conclusion which JPMorgan echoed just days later.
Today, we got the first proof that Bank of America may be right when we observed just how tight liquidity already is in today's sale of $28 billion in 52 week bills by the Treasury, an auction which went so poorly it was widely panned by analysts, with Stone & McCarthy going so far to describe it as terrible.
For those who missed it, this is what happened: today, just before noon, the Treasury sold $28 billion of 52-week bills at a yield of 1.80% versus the when-issued level of 1.775%; while the WI may have been "too rich for the buyside" according to Jefferies economist Ward McCarthy, the massive, 2.5bps tail was the largest on record since Treasury began to auction 1-year bills in June 2008, Stone & McCarthy analysts wrote.
Worse, the bid-to-cover of 2.66 was not only sharply below the 2.87 from last month, it was the lowest since 2008.
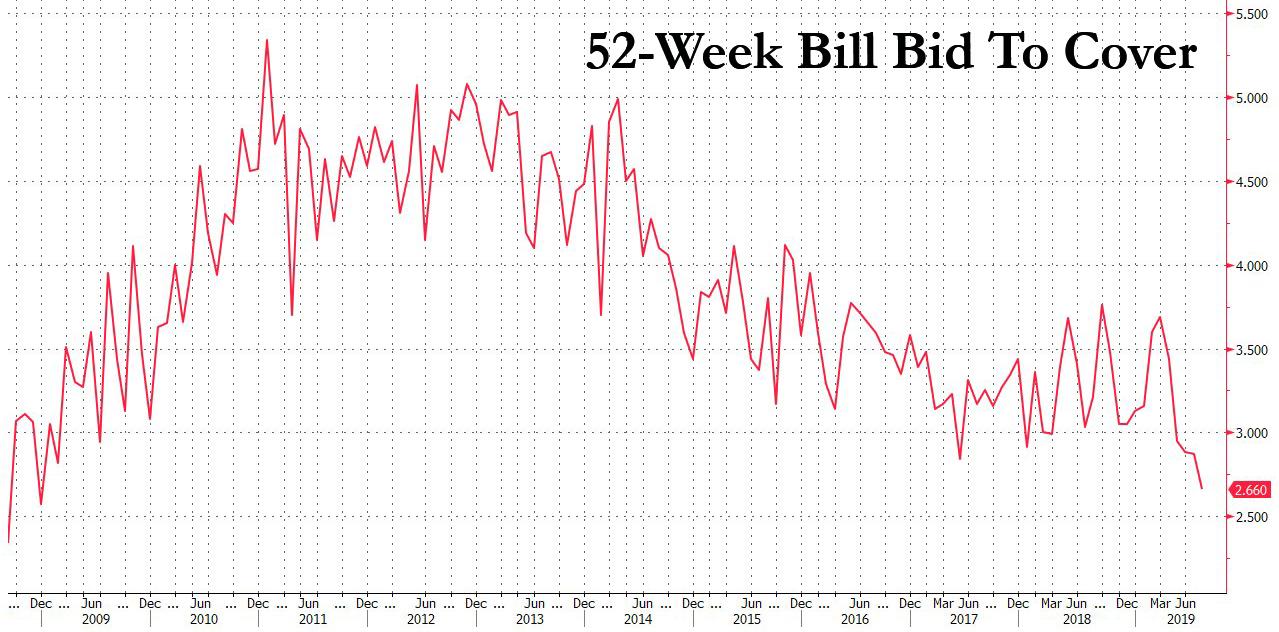
The auction was so ugly, in fact, that it prompted Jefferies to notes that "if you are looking for a pretty auction, look someplace else" while SMRA chimed in that "the combination of extreme recent market volatility and the record auction size made for a terrible auction."
Speaking on Bloomberg TV, Guggenheim Partners CIO Scott Minerd, who recently warned that the coming crash could easily wipe out as much as 50% of the S&P, countered BofA's warning saying that T-bills "aren't a bad place to be," given that there's a lot of supply and short-term rates "are fairly high."
And speaking of supply, there is a lot of it coming: on Monday the Treasury sold 42BN of three-month bills and $42BN of six-month bills on Monday; the size of the three- and six-month tenors were each $3BN larger than prior sales, while the 52-week auction is $2b larger than last month's offering; the combination of settlements for Treasury bill and mid-month coupon auctions is expected raise about $55 billion this week, however it is the coming months that will see a tsunami of Bill issuance as the Treasury scramble to refill its cash balance to $350 billion, meaning Treasury will have a boatload of short-term securities to sell.
For those wondering how to keep track of just how tight funding conditions are becoming, look no further than the repo market, because while the glut of cash has recently softened overnight repo rates, the market may be starting to shift with overnight GC trading around 2.20%/2.18% Friday, ICAP data show; curiously on Tuesday it dipped down to 2.15/2.07 after opening at 2.26/2.24.
"Liquidity should dry up [this] week as recent bill auctions settle on Tuesday, and Thursday's bill and coupon auction settlements raise a combined $34.7 billion," Stone & McCarthy analysts said.
While it remains unclear if the Fed will have to step in and launch QE in the next few months to offset the plunge in market liquidity, a few more "terrible" auctions like today's 52-Week sale and Powell may have no choice.
Commenti
Posta un commento