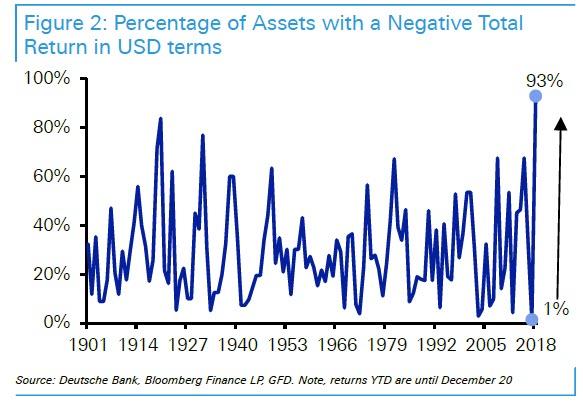
It was last December, which incidentally was the worst December for US equities since the Great Depression, that we showed a remarkable chart: an astounding 93% of all assets tracked by Deutsche Bank were down for the year - worse than even the years of the Great Depression.

2018 would go on to close with a similarly deplorable record: of all assets, only cash posted a positive real return.
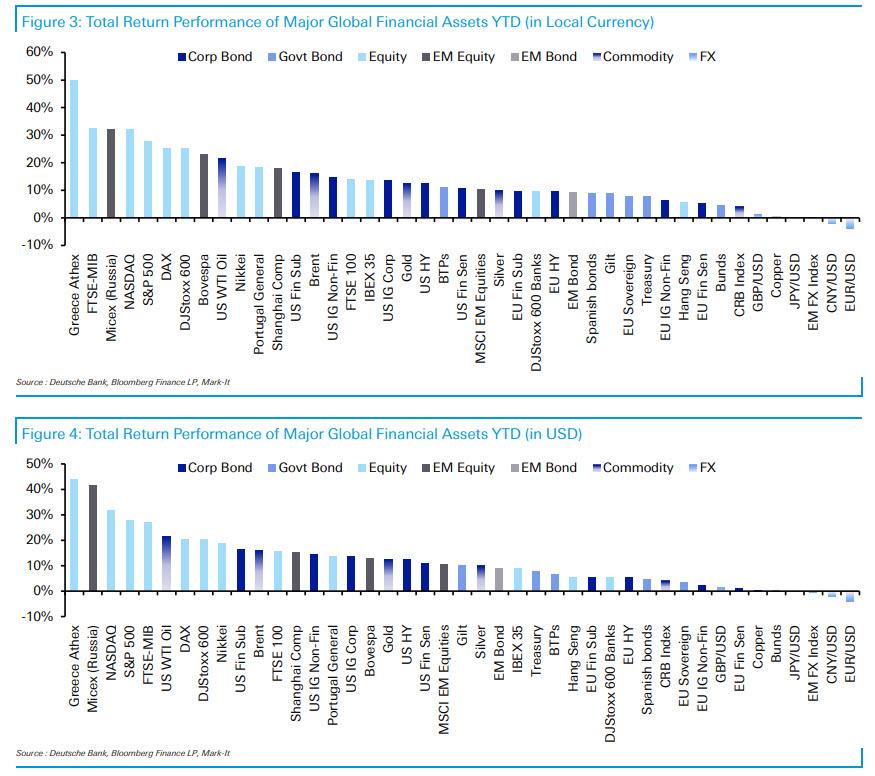
Fast forward 12 months when things couldn't be more different, and with November now in the history books we have a performance mirror image on our hands: as Deutsche Bank's Craig Nicol writes today, all 38 assets in its tracking universe have posted positive YTD returns in both local currency and dollar terms.
Equity markets still lead the way with notable mentions for the Greek Athex (+49.8%), FTSE MIB (+32.4%), MICEX (+32.3%) and NASDAQ (+31.9%). Credit markets are up anywhere from +5.2% to +16.5% with USD outperforming EUR. Meanwhile bond market returns continue to be led by BTPs (+10.9%) while Bunds (+4.4%) lag behind.

A big reason for this performance was the dramatic gains posted in November, a month which "proved to be another good one for risk assets as tentative signs of progress towards a "Phase 1" trade deal between the US and China fuelled sentiment." That, and of course, it was the first full month of the Fed's QE4.
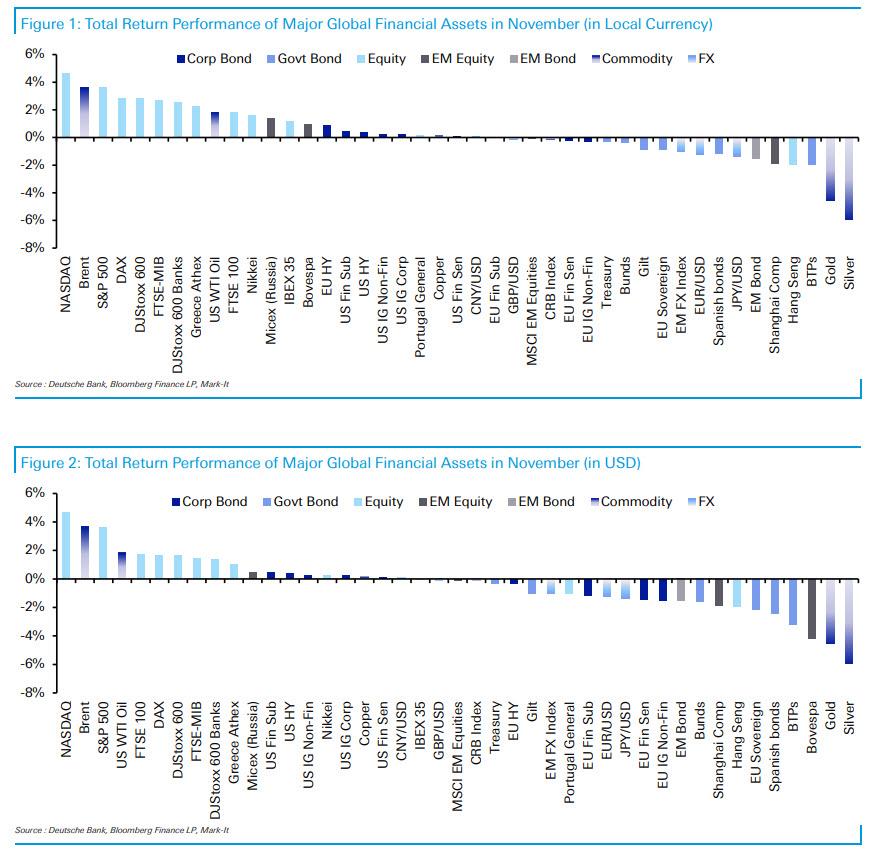
Markets also took hope from the economic data and specifically the stabilization in the PMIs. As such of the 16 equity markets in DB's sample, 13 closed with a positive total return in local currency terms. That of course included fresh new highs for the major US equity markets.
It was a slightly different story in fixed income markets however where higher bond yields acted as a bit of a headwind to returns. The majority of credit markets closed flat to slightly higher in total return terms however bond markets were broadly negative. As a result, when it was all said and done, out of the 38 assets in the bank's sample 23 finished with a positive total return in local currency terms while 19 did so in dollar terms with the dollar appreciating versus the euro, yen and sterling.
That said, those assets which underperformed in November such as precious metals, BTPs, China stocks and sovereign bonds had benefited from an impressive return earlier in the year, so their YTD performance was still positive.
In terms of the details, the top of the leaderboard for equities was dominated by the US where the NASDAQ and S&P 500 returned +4.7% and +3.6% respectively. That means we've now seen positive total returns for both of these indices in 9 of the 11 months this year.
Meanwhile in Europe we saw the STOXX 600 return +2.9%, DAX +2.9%, FTSE MIB +2.7%, European Banks +2.6% and FTSE 100 +1.8%. Asia lagged with the Nikkei up +1.6% but the Shanghai Comp and Hang Seng down -1.9% and -2.0% respectively with the protests in Hong Kong clearly impeding the latter.
As for fixed income markets, Treasuries (-0.3%) and Bunds (-0.4%) finished with slightly negative total returns while Gilts (-0.9%), Spanish Bonds (-1.2%), EM bonds (-1.6%) and BTPs (-1.9%) suffered heavier losses. That acted as a headwind to IG credit with US IG non-fins retuning +0.3% and EUR IG non-fins -0.3%. High yield fared slightly better, returning +0.9% for EUR and +0.4% for US. Finally, commodity markets book-ended the leaderboard last month with Brent returning +3.7%, while Gold and Silver returned -4.6% and -6.0%. Copper finished +0.2%.

With "trade deal optimism" expected to continue well into 2020 and perhaps until the presidential election, alongside the Fed's NOT QE, there are few indications that anything can change this trend as we close out the decade.
Commenti
Posta un commento