Passa ai contenuti principali

Nomura Warns Of Imminent "Gamma-Flip" Risk In Stocks

While the last few weeks have seen endless headlines that "a trade deal is close" which, thanks to headline-scanning algos has ignited an endless short-squeeze to lift stocks to record highs, the last two days have seen a very sudden and very dramatic plunge in stocks on the heels of some less-than-positive trade-deal comments.

This has plunged the market's odds of a deal notably...

Source: Bloomberg

But, the velocity of the collapse in stocks has many wondering what else is going on. The answer, as Nomura's Charlie McElligott explains below is simple - what forced self-reinforcing buying pressure on the way up is about to feed a vicious cycle of selling on the way down as stocks face an imminent "gamma flip."

As we warned earlier today:

And McEligott explains:

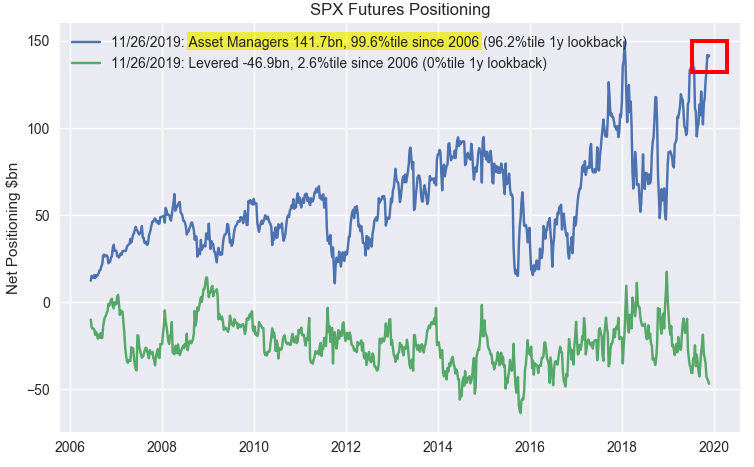
The interpretation of Trump's "better to wait until after the election" for a China trade deal comments is that the Hong Kong human rights bill sponsorship by POTUS has clearly caused agitated the Chinese side (plus this morning's Reuters report stating that the White House is considering kicking Huawei out of the US banking system), and in conjunction with the narrowing window to act on the Dec 15th tariff "fill or kill," is likely incentivizing monetization of of the +9% gain made in S&P since early October via profit-taking in recently Options- ($Delta still 94th %ile since 2013 even after yday's selloff) and Futures- (Asset Manager S&P Futures $notional position currently 99.6th %Ile since 2006 at $141.7B) positioning "extremes."

This "extreme positioning" into a dynamic where traders are incentivized to monetize into year-end—especially ahead of the Dec 15th "tariff risk"—has been at the core of my view over the past few weeks that there was a local / tactical "window for a pullback" into late November (start Dec ain't bad though).

As such, this risk-off dynamic is driving the bid in Rates / USTs (Reds and Greens +6 to +8 ticks, while we've seen Real Money and Central Bank buying flows in the front-end—thus the "bull steepening"), which too then will almost certainly result in a reversal later today of the US Equities factor dynamic experienced on Monday (Momentum down, Value up); instead, today's UST rally will then dictate a resumption of the "Momentum" bounce-back experienced over the past 3 weeks, as longs in "Duration" Equities ("Min Vol" Defensives and "Secular Growth") are set to rally, with "Cyclicals" are likely to again fall.

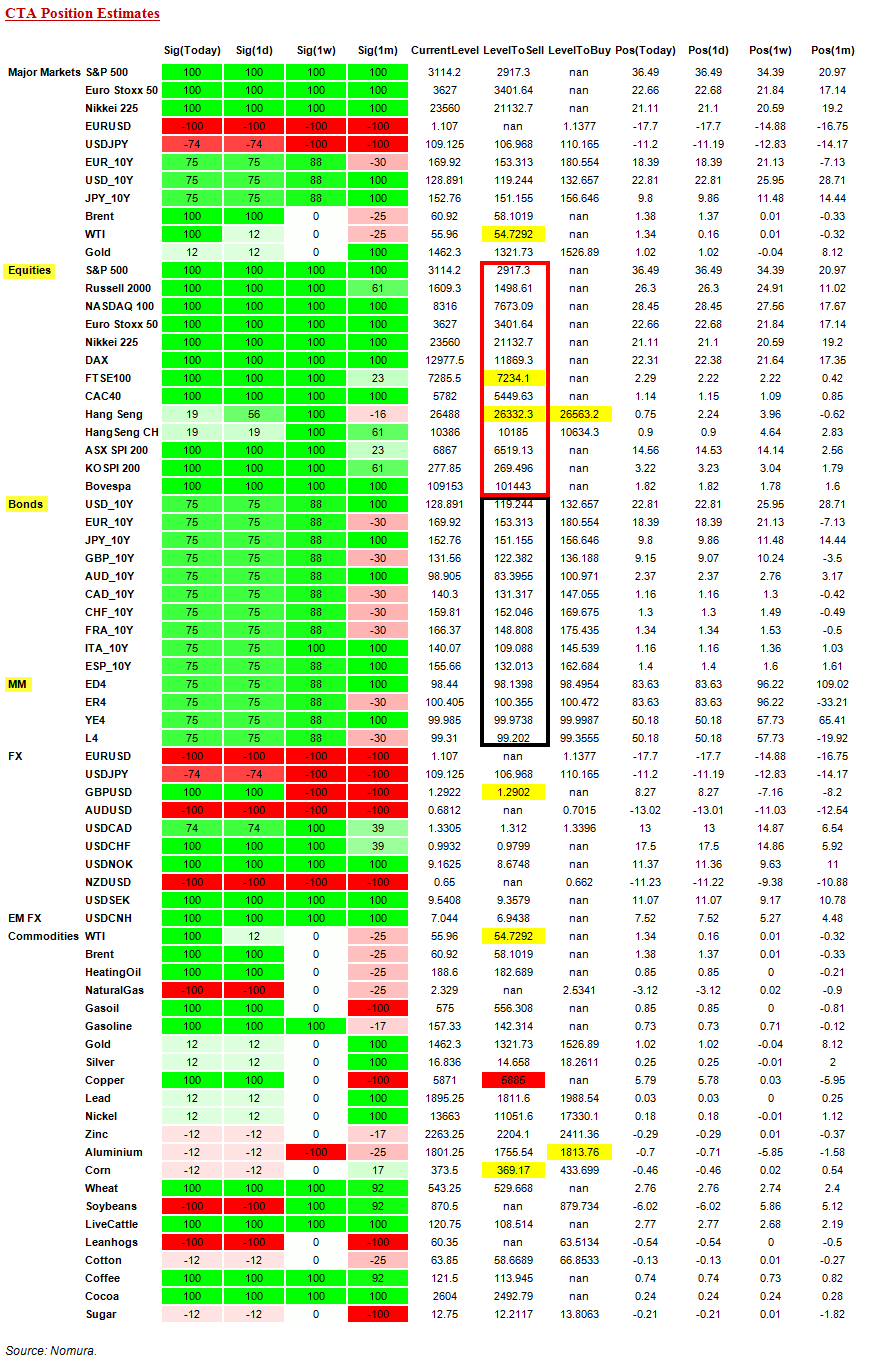
Touching on my constant refrain over the past two years—that being where a "macro shock" then acts as catalyst for Dealer Gamma "flip" and / or in conjunction with a Systematic Trend deleveraging impulse—we see a mixed-bag, as our Nomura QIS CTA model shows the majority of Equities futures positions remain "in trend" and ABOVE estimated deleveraging / "sell" levels.

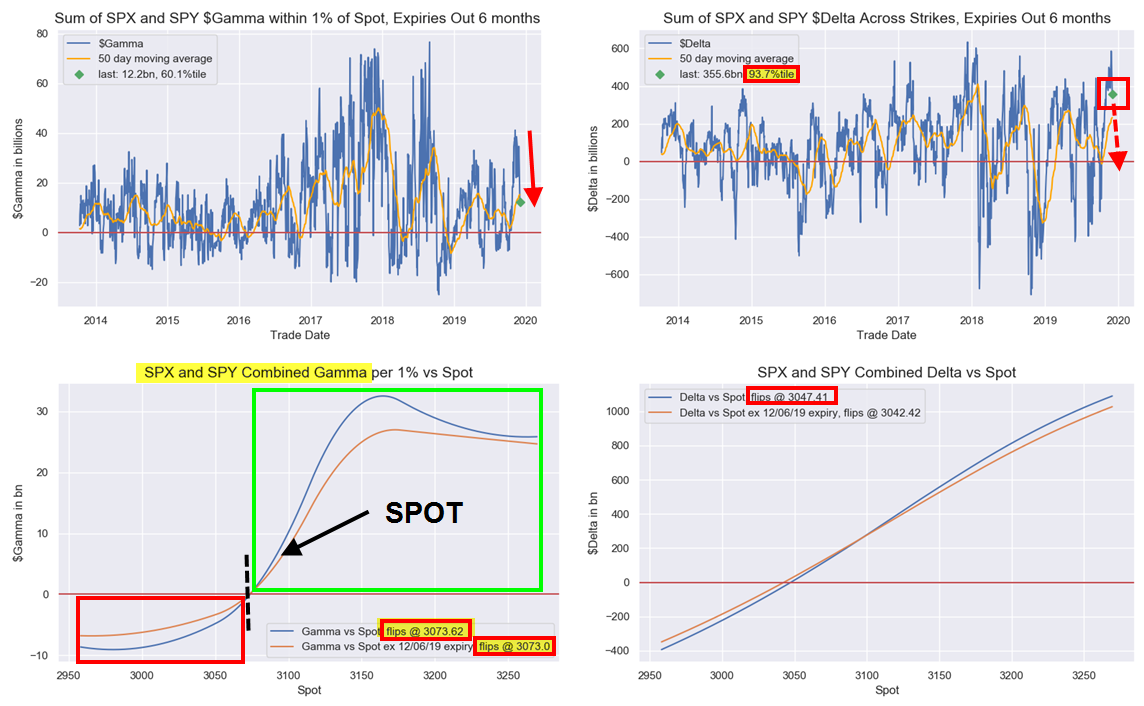
HOWEVER looking at SPX options, we see the Dealer $Gamma position nearing the potential "flip" level to "SHORT GAMMA" ~ 3073 (spot 3083 last), which would of course beget more selling the hedge the lower futures travel and further incentivize that massive Asset Manager futures "length" to monetize profits on the multi-month rally:

Both the Equities and Global DM Bond / Rates positions for CTA's remain firmly in "no man's land" relative to any sort of "deleveraging triggers"

  • Today's estimates for the S&P futures position for CTAs show no reduction of the current "+100%" signal until all the way under 2916 (which would see the signal drop to just "+25%")

  • In TY (current signal at "+75%" Long), we would not see any selling / deleveraging until all the way down at 121.41 as the DEEPLY "in the money / in trend" 1Y window ("Long") would "flip" and turn the signal entirely "-100%" Short—and that's not gonna happen, LOL

Back to Equities however, the larger risk today for a "sloppy" move lower in US Stocks would be via Dealer "Greek" exposures via Options positioning, as our analysis of the Dealer Gamma position across consolidated SPX / SPY options is just ~12 handles ABOVE a potential "flip SHORT" level ~3073—but in true "negative convexity" / "short Gamma" fashion, we are accelerating as we turn lower.

And sure enough, S&P Futs plunged through that critical level...

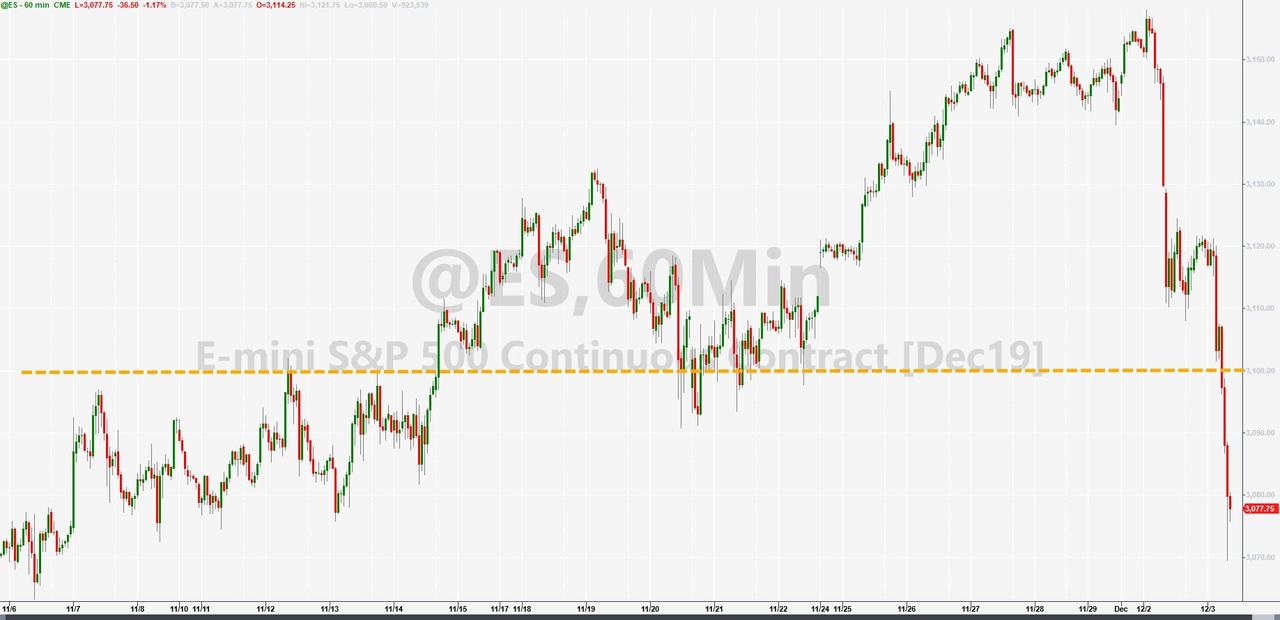
We are going to need a serious walk-back of Trump's comments to rescue this one... where's Kudlow!?

Commenti

Post popolari in questo blog

Fwd: The Looming Bank Collapse The U.S. financial system could be on the cusp of calamity. This time, we might not be able to save it.

After months  of living with the coronavirus pandemic, American citizens are well aware of the toll it has taken on the economy: broken supply chains, record unemployment, failing small businesses. All of these factors are serious and could mire the United States in a deep, prolonged recession. But there's another threat to the economy, too. It lurks on the balance sheets of the big banks, and it could be cataclysmic. Imagine if, in addition to all the uncertainty surrounding the pandemic, you woke up one morning to find that the financial sector had collapsed. You may think that such a crisis is unlikely, with memories of the 2008 crash still so fresh. But banks learned few lessons from that calamity, and new laws intended to keep them from taking on too much risk have failed to do so. As a result, we could be on the precipice of another crash, one different from 2008 less in kind than in degree. This one could be worse. John Lawrence: Inside the 2008 financial crash The financial...

Charting the World Economy: The U.S. Jobs Market Is On Fire - Bloomberg

Charting the World Economy: The U.S. Jobs Market Is On Fire - Bloomberg https://www.bloomberg.com/news/articles/2019-12-06/charting-the-world-economy-the-u-s-jobs-market-is-on-fire Charting the World Economy: The U.S. Jobs Market Is On Fire Zoe Schneeweiss Explore what's moving the global economy in the new season of the Stephanomics podcast. Subscribe via  Apple Podcast , Spotify or  Pocket Cast . The last U.S. payrolls report of the decade was a doozy, beating expectations and doing its bit to keep the consumer in good health heading into 2020. That's good news given the various pressures still weighing on global growth. Here's some of the charts that appeared on Bloomberg this week, offering a pictorial insight into the latest developments in the global economy. U.S. Advertisement Scroll to continue with content ...

The Inverted Yield Curve: Why It Will Not Lead To A Recession This Time | Seeking Alpha

The Inverted Yield Curve: Why It Will Not Lead To A Recession This Time | Seeking Alpha The Inverted Yield Curve: Why It Will Not Lead To A Recession This Time Apr. 23, 2019 8:41 AM ET Historically, an inverted yield curve has invariably led to a recession. We are currently experiencing an inverted yield curve. We have two reasons for the current inverted yield curve: the central banks irrationally raising short-term interest rates and investors expect a recession because of the extended boom period. The two reasons are not enough to lead to a recession, and other structural changes in the economy are pointing to a boom rather than a recession. Investors can capitalize on the current situation if they believe that the inverted yield cure would not lead to a recession. Summary and Paper Thesis Although an inverted yield curve led to a recession almost without exception in the last 50 years within a relatively short period of time after the inversion happened, this pap...