Passa ai contenuti principali

Just How Overvalued Is The Market? Here Are 20 Metrics To Help You Decide

Now that the S&P 500 has finally broken out above the key psychological resistance of 3,000 which served as a ceiling to risk assets for the past two years, the market has entered fresh nosebleed valuation territory.

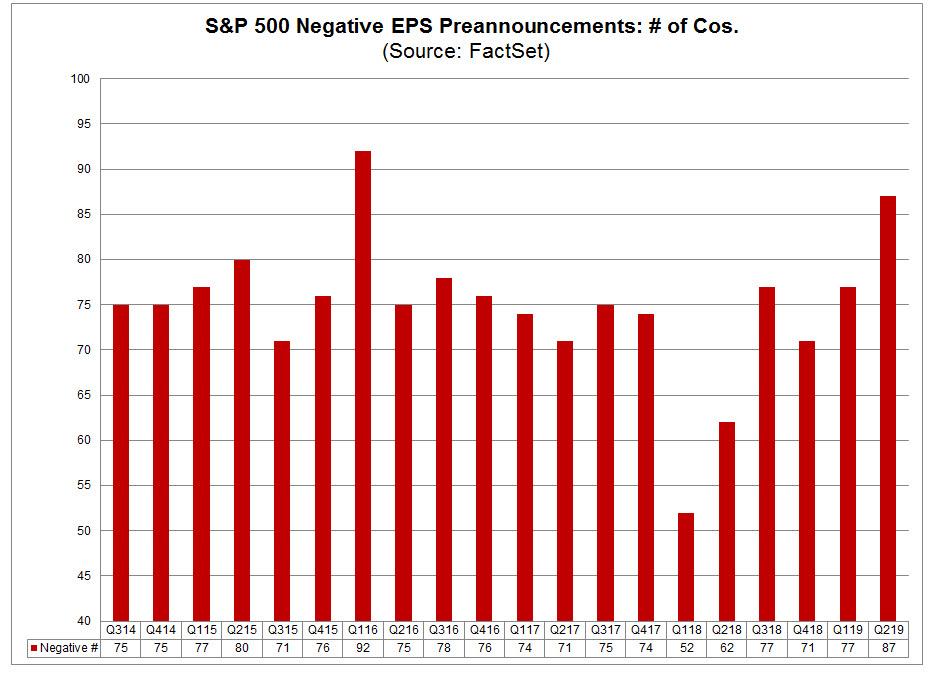
As Bank of America writes today, following one of the strongest June markets ever, the forward P/E of the S&P 500 on consensus estimates rose by 6% to 16.7x. However, unlike JPMorgan which like a good penguin raised its year end 3,000 price target to 3,200 just to stay ahead of the market, Bank of America - just like Morgan Stanley - refuses to do that (for now) and warns of downside risk to consensus earnings (they forecast $176 over the next 12 months or NTM) putting the S&P 500 PE at 17.4x on the bank's NTM forecast ($169), which is hardly a bargain, while noting that guidance for the 2H and 2020 has turned sharply negative (as we reported at the end of June, the second highest number of S&P500 companies is issuing negative guidance).

Yet while the market's multiples on earnings look elevated relative to history, they still look cheap on growth (assuming such growth is justified in a world where central banks are set to cut rates due to a sharp economic slowdown and trade war), cash flow and relative to bonds. Indeed, there is one place where stocks looks decidedly cheap - when dividend yields are compared to bond yields, or as BofA writes, "the yield opportunities within the S&P 500 can't be ignored in light of the Fed's accommodative stance: almost 60% of S&P 500 stocks' dividend yield eclipses expectations for the year-end Fed target rate."

Stripping away BofA's subjective commentary, to allow readers to decide for themselves whether stocks are massively overvalued and overbought, or perhaps cheap compared to the world's biggest bond bubble, here is a breakdown of the S&P 500 across a wide variety of valuation measures proposed by Bank of America, 20 in total.  What the analysis shows is that of 20 metrics, the S&P is overvalued based on 17 by as much as 92% (on a historical market cap to GDP basis) and up to 122% if looking at the S&P in WTI terms, and is cheap only according Price to Free Cash Flow (23.6x vs 28.0x) which however is a function of ultra low interest rates, and also based on a ratio of both Trailing (-14% cheap) and Forward (-6% cheap) PEG multiples.

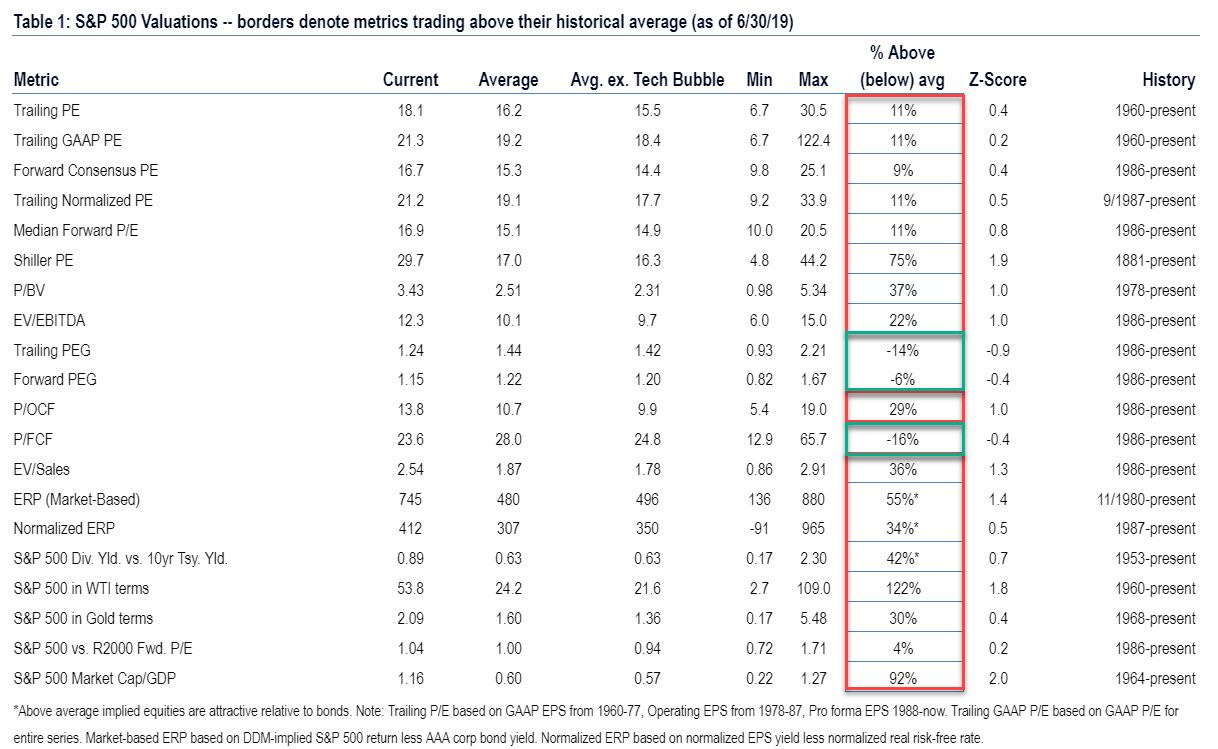
What the analysis above demonstrates, is that if analysts' overly optimistic earnings forecasts are materially, or even modestly, wrong then watch out below as the market will soon be overvalued on virtually every single metric, with the appropriate impact on stock price to follow shortly.

Commenti

Post popolari in questo blog

Fwd: The Looming Bank Collapse The U.S. financial system could be on the cusp of calamity. This time, we might not be able to save it.

After months  of living with the coronavirus pandemic, American citizens are well aware of the toll it has taken on the economy: broken supply chains, record unemployment, failing small businesses. All of these factors are serious and could mire the United States in a deep, prolonged recession. But there's another threat to the economy, too. It lurks on the balance sheets of the big banks, and it could be cataclysmic. Imagine if, in addition to all the uncertainty surrounding the pandemic, you woke up one morning to find that the financial sector had collapsed. You may think that such a crisis is unlikely, with memories of the 2008 crash still so fresh. But banks learned few lessons from that calamity, and new laws intended to keep them from taking on too much risk have failed to do so. As a result, we could be on the precipice of another crash, one different from 2008 less in kind than in degree. This one could be worse. John Lawrence: Inside the 2008 financial crash The financial...

Charting the World Economy: The U.S. Jobs Market Is On Fire - Bloomberg

Charting the World Economy: The U.S. Jobs Market Is On Fire - Bloomberg https://www.bloomberg.com/news/articles/2019-12-06/charting-the-world-economy-the-u-s-jobs-market-is-on-fire Charting the World Economy: The U.S. Jobs Market Is On Fire Zoe Schneeweiss Explore what's moving the global economy in the new season of the Stephanomics podcast. Subscribe via  Apple Podcast , Spotify or  Pocket Cast . The last U.S. payrolls report of the decade was a doozy, beating expectations and doing its bit to keep the consumer in good health heading into 2020. That's good news given the various pressures still weighing on global growth. Here's some of the charts that appeared on Bloomberg this week, offering a pictorial insight into the latest developments in the global economy. U.S. Advertisement Scroll to continue with content ...

The Inverted Yield Curve: Why It Will Not Lead To A Recession This Time | Seeking Alpha

The Inverted Yield Curve: Why It Will Not Lead To A Recession This Time | Seeking Alpha The Inverted Yield Curve: Why It Will Not Lead To A Recession This Time Apr. 23, 2019 8:41 AM ET Historically, an inverted yield curve has invariably led to a recession. We are currently experiencing an inverted yield curve. We have two reasons for the current inverted yield curve: the central banks irrationally raising short-term interest rates and investors expect a recession because of the extended boom period. The two reasons are not enough to lead to a recession, and other structural changes in the economy are pointing to a boom rather than a recession. Investors can capitalize on the current situation if they believe that the inverted yield cure would not lead to a recession. Summary and Paper Thesis Although an inverted yield curve led to a recession almost without exception in the last 50 years within a relatively short period of time after the inversion happened, this pap...