A gigantic spike in 3 years. The UK dominates.
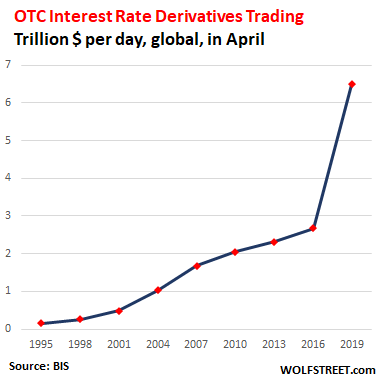
The volume of over-the-counter (OTC) interest rate derivatives traded globally soared by 141% in three years to $6.5 trillion per day in April 2019, according to the Bank for International Settlements' new Triennial Survey of Global Derivatives Markets. In the prior survey period, April 2016, $2.7 trillion per day in trades were executed. Since 2001, the magnitude of trading volume has multiplied by a factor of 13, from $490 billion per day to $6.5 trillion per day, with a gigantic spike over the past three years:
OTC derivatives are securities that are generally traded through a dealer network rather than on a centralized exchange such as the London Stock Exchange or the New York Stock Exchange.
Some derivatives can be explosive, such as the credit default swaps (CDS) that brought Lehman Brothers and AIG to their knees in the last crisis, and which still remain a threat today, especially with the U.S. government this week bowing to Wall Street pressure to dilute regulation that had been designed after the crisis to reduce the risks of these instruments.
Interest rate derivatives, whose value rises and falls depending on the movement of interest rates, or sets of interest rates, tend to be more straightforward. They are often used as hedges by institutional and retail investors, banks and companies to protect themselves against changes in market interest rates. If managed properly, they shouldn't pose undue risks to the financial system.
The BIS attributed much of this 141% three-year surge in trading of these instruments to increased hedging and positioning "amid shifting prospects for growth and monetary policy." It also cautioned that some of the turnover in April 2019 was in shorter-term contracts, which are rolled over more often, leading to higher volume of trades. The 2019 survey also featured more comprehensive reporting of related party trades than in previous surveys. After adjusting for these trades, the actual increase in trading volumes since the 2016 survey is more likely to be around 120%, the BIS concluded.
Here's where most of the trading OTC interest rate derivatives took place:
- The City of London: $3.7 trillion per day or 56% of global trades were executed at trading desks in the United Kingdom, a 213% leap from the $1.18 trillion of average daily turnover in April 2016. Most of those trades took place in the City of London.
- The United States: $2.35 trillion per day, or 32% of the global turnover, up 9.8% from $1.24 trillion in 2016. Back in 2016, the U.S. had been for a brief moment the world's biggest market in these instruments with a share of 41%.
- Hong Kong SAR: $436 billion per day. This was up almost four-fold from $110 billion per day in April 2016. Driven largely by increased turnover in Australian dollar-denominated contracts, this growth in trades takes Hong Kong's share of global turnover to 6%, from 3.6% share three years ago. In mainland China, by contrast, an average of just $16 billion of interest rate derivatives were traded daily in 2019.
- The Eurozone. Turnover reported at sales desks in euro area countries remained relatively meager this year, reaching $256 billion per day, or 3.5% of the total turnover in April 2019.The largest euro area trading center, France, saw turnover fall from $141 billion per day to $120 billion per day in the last three years, taking its share of global turnover to 1.6% from 4.6% in 2016 and 8.1% in 2007.
- Other worthy mentions: Japan saw daily trading volume rise to $135 billion per day (from $56 billion), and Singapore, to $109 billion per day (from $58 billion), taking their share of the global total to 1.8% and 1.5% respectively.
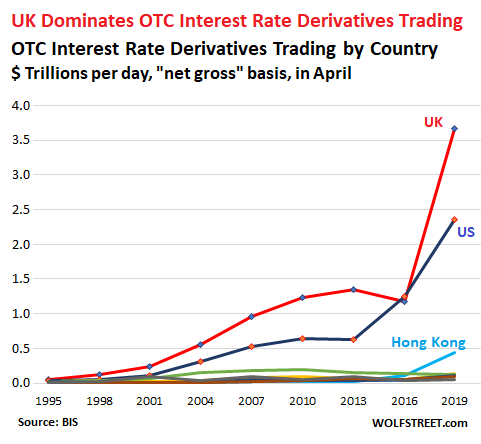
The U.S. and the UK combined accounted for 82% of total turnover of interest rate derivatives in April this year, up from 79% in 2016. Even after three years of regulatory tussles with its biggest trading partner, the EU, the UK has not only maintained its grip on the vast and fast growing OTC derivatives markets, it's strengthened it, pulling away from New York and leaving Paris in the dust.
"London is the capital of capital and this report shows that despite challenging times, the fundamentals of the City remain strong," said Catherine McGuinness, policy chair at the City of London Corporation, the municipal governing body.
The UK trading also dominates in global currency markets, albeit not quite as much. In April 2019, its FX trading desks generated a turnover of $3.58 trillion per day, up from $2.41 trillion per day in 2016, taking its share of total global FX activity from 37% to 43%. By contrast, the US share of trading declined during the same period from 20% to 17%.
In France, the UK's biggest EU competitor, the trading volumes also fell, from $181 billion per day three years ago to $167 billion per day in April 2019, tiny compared to the $3.58 trillion per day on London's exchanges. In Germany, the average daily FX trading volumes are even smaller, clocking in at $124 billion per day, up from $116 billion per day three years ago.
That London has also managed to increase its share of trading euro-denominated interest rate swaps, accounting for 86% of the global total, up from 75% in 2016, will be of particular concern to Brussels. For years, the French government, together with the ECB, have sought to wrest control of the trading and clearing of euro-denominated transactions from the City of London, for mainly justifiable reasons. And Brexit was supposed to provide the perfect alibi. But alas, as this BIS report emphatically shows, it hasn't happened yet!
- Ottieni link
- X
- Altre app
- Ottieni link
- X
- Altre app
Commenti
Posta un commento