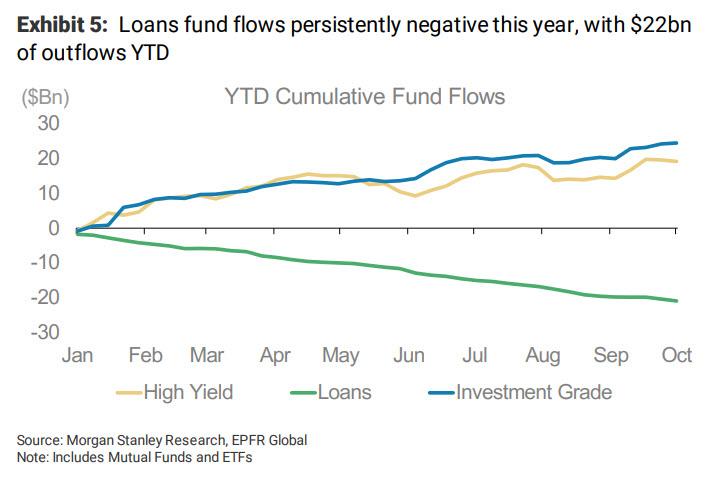
In many ways, the fact that the leveraged loan market has been so remarkably stable, despite the occasional high profile blow up, in a time of relentless redemptions from loan funds which have seen weekly outflows for nearly one full year resulting in $22BN in outflows YTD...
... coupled with dropping rates, both of which shrink the attractiveness of variable rate loan instruments, is a story onto itself. However, as Morgan Stanley writes in a report over the weekend, "the cracks in leveraged credit markets are expanding" and becoming more apparent.
As Morgan Stanley's Srikanth Sankaran writes, "beneath the veneer of relative spread resilience and muted realized defaults, the weak links in the leveraged credit markets are coming under pressure."
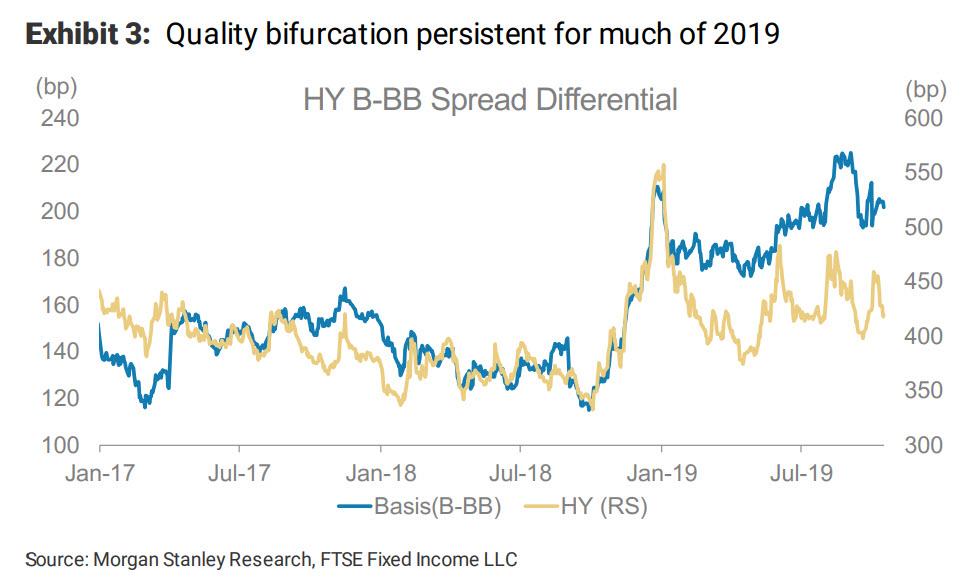
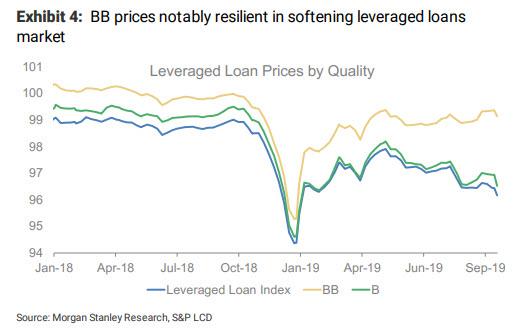
One notable such fault line is spread decompression, which has been a dominant theme in both leveraged loans and HY, with the B-BB basis expanding by ~24bp in HY and ~56bp in loans from the January tights.
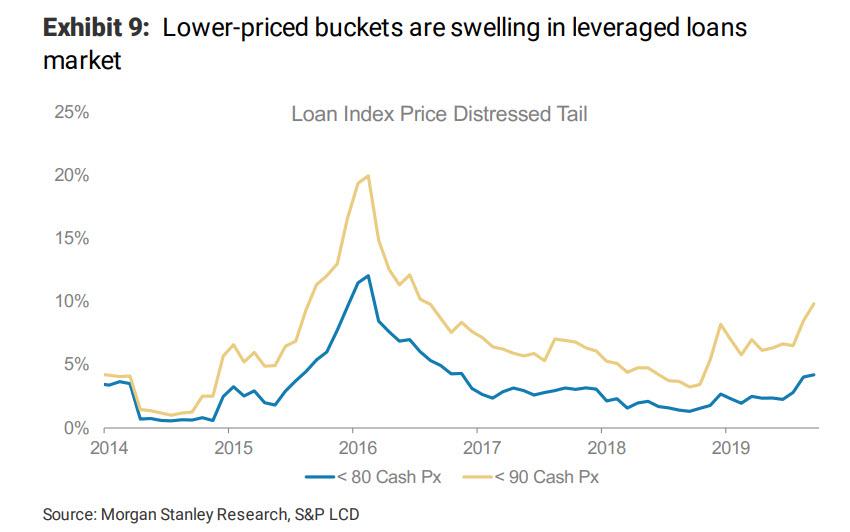
Another indication that the loan market is starting to crack: distressed tails in both asset classes are also back on the rise, and while energy remains the dominant contributor to the HY tail, Morgan Stanley finds more sector diversity in loans trading below 90 cash price.
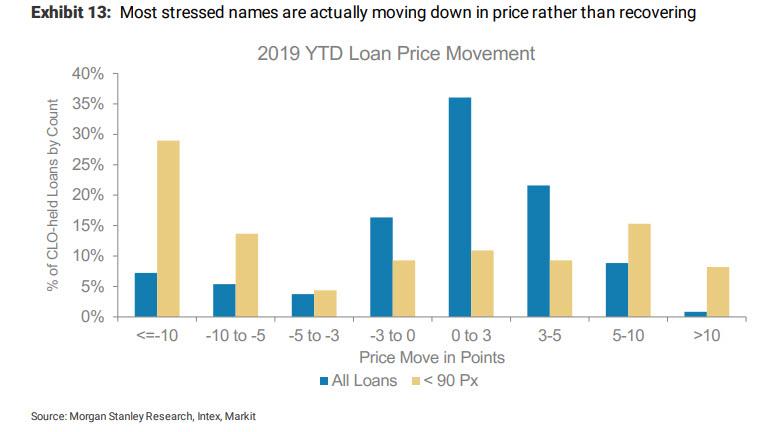
But the biggest tell that investors are starting to sour on what one year ago was the most desired part of the capital structure, is that - as in other, more illiquid pockets of the market - "big" price/spread moves are happening more frequently, "even outside the stressed buckets". And while the jump pattern is more symmetric in HY, pointing to continued demand for big movers, by contrast in loans, the big price moves exhibit a strong downside skew, particularly in the case of facilities that started the year at stressed levels.
Also worth noting is that large moves are also happening more frequently outside the tails: while the increase in credits trading at stressed levels is ominous, it presents only a partial picture of underlying price dynamics, according to MS. Even outside the tails, the bank sees a growing incidence of big spread/price moves in individual credits.
Morgan Stanley counts 1,476 individual HY bonds that have seen spreads gap wider by 50bp or more over a one-month window. However, there is also a strong rebound pattern in that instances of significant spread tightening are also high. As a result, the aggregate distribution of YTD spread changes does not show much evidence of a broad-based malaise within the HY bond market.
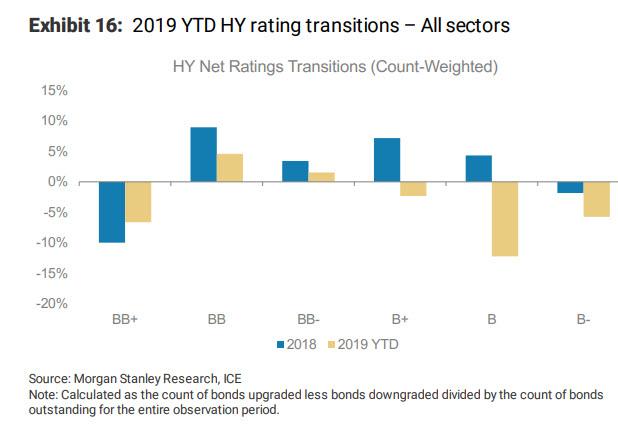
One possible explanation for these sudden repricings: investors are anticipating declining fundamentals in the form of ratings downgrades. As MS notes, consistent with the price discontinuity patterns, net downgrades in leveraged loans have also accelerated in recent months – up 106% YoY and tracking the highest levels since the energy crisis.
Meanwhile, 6% of loan facilities that were rated B or better at the beginning of the year have migrated into the B- bucket YTD, while the YTD downgrades from B- are 16%. These ratings transition trends increase the risk of a negative price feedback loop developing in B- and CCC credits, as they become a pinch point for CLO holdings.
Some more details:
Net downgrades are on the rise in HY bonds even after adjusting for energy. Stress is particularly concentrated in the single-B buckets, where MS counted ~160 downgrades in the HY index so far in 2019, roughly the same as the count for the whole of 2018 but the upgrade count is significantly lower (140 this year versus 235 in 2018). The next chart shows the net transitions across the different ratings categories and highlights that the deterioration in ratings profile is broad based. The inflection versus last year is particularly pronounced in the single-B buckets, tracking 12% for the B (flat)notch.
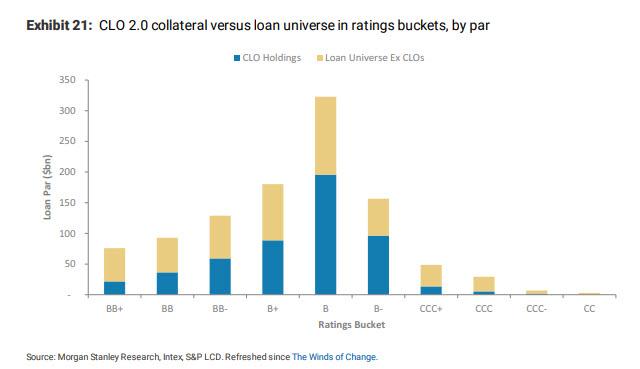
These accelerating net downgrades are also exacerbating the quality skew in CLO portfolios, ostensibly the biggest sources of demand for leveraged loans. As MS notes, the economics of CLO creation have prompted managers to run an overweight in the B ratings bucket versus the LSTA loan index for some time now. Higher downgrades and lower repayment rates in Bs have therefore further exacerbated the quality distribution within CLO portfolios. As shown below, 2.0 CLOs now own 62% of the outstanding B- market and 58% of all B rated facilities (by par). However, for the CCC and BB rated facilities, CLO ownership rates drop to 25% and 39%. This indicates that the shift in ratings mix has been mirrored in the larger loan index; indeed, we see that the share of B- loans in the index has increased by 2.3% since the end of April.
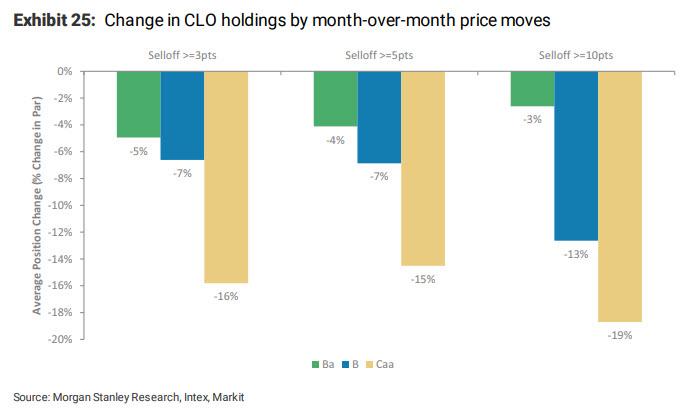
One final point: as prices drop, a feedback loop emerges, as selling pressure from CLOs exacerbating price moves in the loan market, pushing prices even lower. Specifically, studying CLO manager behavior surrounding large price declines in loans, MS finds that, in aggregate:
- managers prefer to retain the optionality of a price rebound when better-rated loans sell off
- within the B ratings bucket, managers are much more willing to sell in really large price declines (10+ points), and
- the willingness to sell is particularly high in CCCs.
As an aside on the pertinent issue of ratings transitions, MS notes that while CLO docs do not generally have a way to force managers to sell specific CCC/Caa-rated loans, larger holdings in that bucket can impact both cashflows and managers abilities to execute other trades. It is therefore still important to remain cognizant of manager behavior as it relates to lower-rated loans.
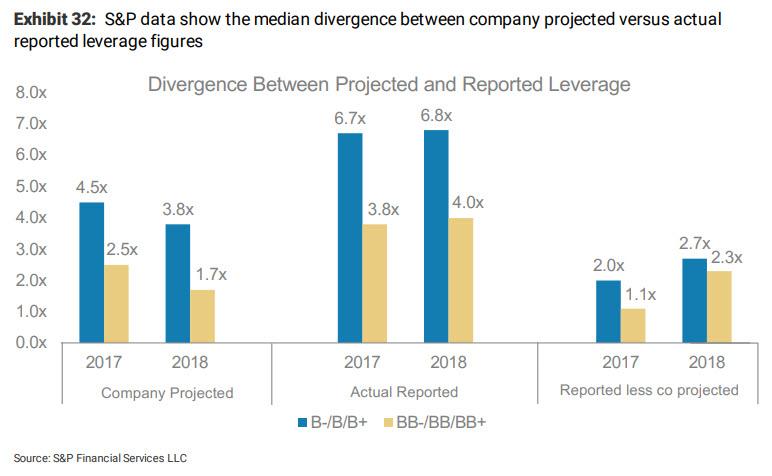
Having observed the escalating cracks in the loan market, it is not surprising that Morgan Stanley maintains a "quality bias" within credit and expects further decompression in HY bonds. In leveraged loans, the sensitivity to earnings is particularly high, given the preponderance of EBITDA add backs, and a further scrutiny of the "quality" label is warranted. A recent study by S&P on the performance of issuers versus the EBITDA projections is telling in this regard. To wit, in 2018 earnings, nearly a third of companies in the study sample missed EBITDA projections by 50% or more, two years after coming to market. Compliance on debt reduction plans was also poor, as a result of which the median gap between actual and reported leverage was 2.7x for B rated companies and only marginally better at 2.3x for BB companies. While the rating agency emphasizes that these misses do not directly feed into the ratings methodology, the findings reinforce our point on stressing the definition of "high quality" further.
And in the clearest warning yet that a violent crack in loan pricing may be imminent, Morgan Stanley warns that within CLO structures, it prefers to be "up the capital structure", particularly the AAA rated tranche, while remaining "more cautious on BBs and equity." That's because, the junior parts of the capital structure remain most vulnerable to the price and ratings stresses developing in the loan market. On the other hand, the structural protections within CLOs cause deals to delever in the event these stresses materialize, meaning that senior debt-holders begin to get their principal back ahead of schedule.
In short, for all those expecting the credit market to be the catalyst for the next crisis, watch this space closely: if Morgan Stanley is correct, not only has the next crisis already begun, but one can already keep track of how far along it has moved thanks to the cracks that are becoming all too apparent in the leveraged loan market.
Commenti
Posta un commento