
The bond market may have a different idea and the charts need to be closely watched into 2020.
Hence I wanted to follow up on my recent interview on CNBC Fast Money where I was asked about the reflation trade and I referred to the 10 year and the $TLT charts.
Here's the interview for reference:


And don't think I'm just some twitter conspiracy nut.
You know I've been on this all year.
Others see it as well.
We all see it.
Yet the Fed keeps hiding in silence refusing to acknowledge their role.

The Fed of course trying to bring about the reflation trade, but then of course went overboard on the liquidity front when forced into fixing the leaking repo boat.
Markets took the rise in stocks and coming trade agreement with China as evidence that the reflation trade was fully back on.
Problem is: The bond market does not appear to agree.
In the interview I referred to a bear flag on the 10 year, $TNX. If there is evidence of a reflation trade to come where is it? It's not evidenced in this chart:
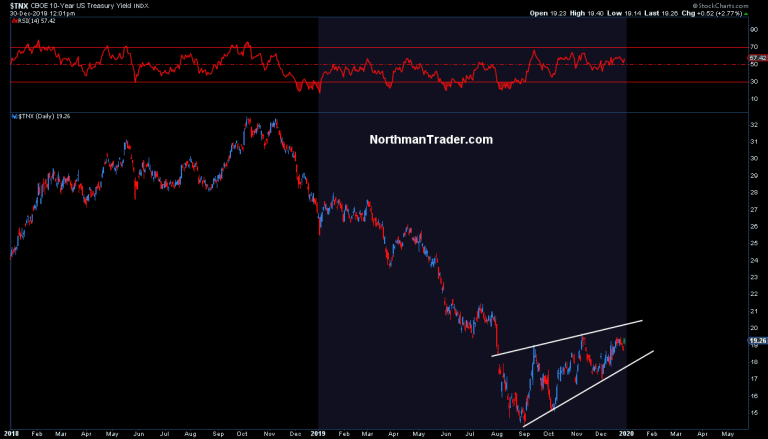
Now a pattern is not confirmed until it shows confirmation, but this pattern here is very clean so far. The 10 year hasn't even managed to approach the July highs which means the 10 year has entirely ignored the market rally of Q4.
Now the pattern has room higher for the 10 year, it could even headr into the 2.1% range and still be inside this pattern. But what the pattern suggests is that a break down could not only invite a retest of the lows, but even new lows are possible.
That's a problem and would render reflation narratives wrong.
Which brings me to the $TLT chart, with one of the strongest most consistent trends out there:
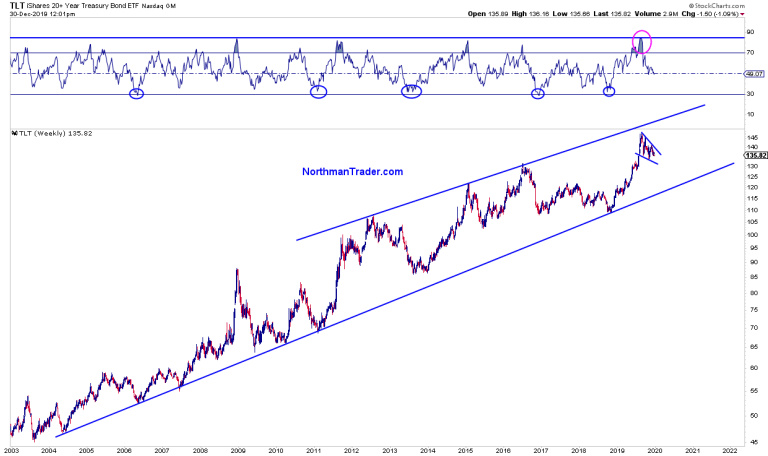
Where did $TLT bottom in 2018? Right smack on top of its 2004 support trend line. 2019 has seen a furious rally in $TLT as yields collapsed world wide. In process $TLT printed its most overbought reading in this century.
So no wonder we saw a reversal and this reversal was seen as a bottom in yields. Well, what does this chart actually suggest? As with $TNX we see a flag building. A bullish flag also suggesting that reflation celebrations may be very much pre-mature.
If anything this chart suggests that if the pattern confirms and breaks out higher we may see a run back to the top of the upper trend line.
And you know what that means right? That the Fed is not only not done cutting rates it may be heading back to zero and then this Q4 rally, which may extend into early 2020, was just a liquidity mirage that failed to bring about reflation.
Remember where we are in the cycle:
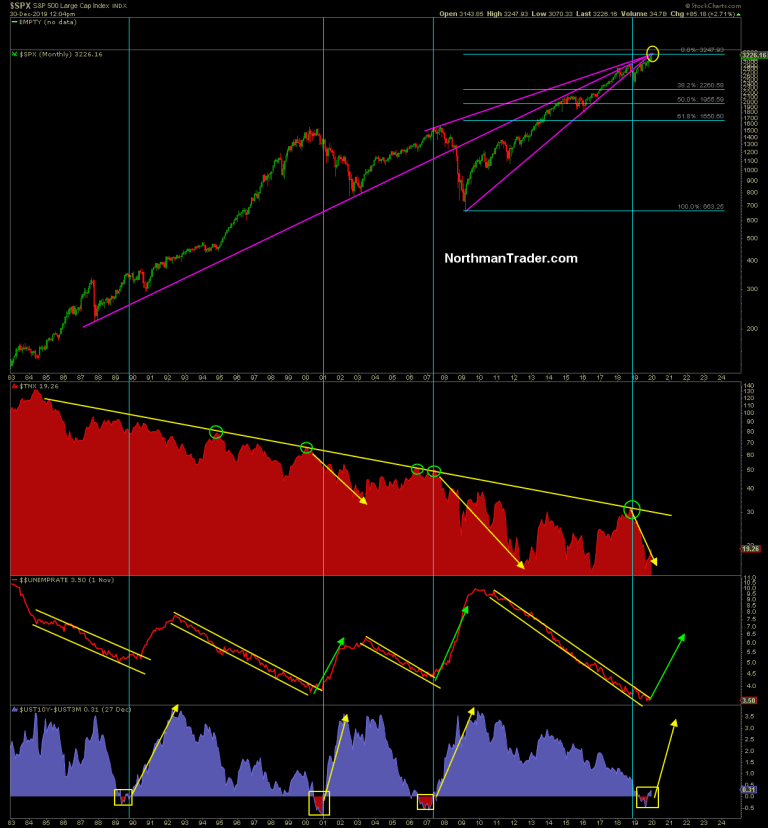
The Q4 rally was as ferocious as it was one sided and it even exceeded my combustion scenario in target. But here's what it hasn't done: It has failed to recapture the broken 2009 trend and it has brought price to the apex resistance of three major trend lines. 2009, 2007 and 1987.
The other thing this rally has failed to do: Confirm reflation. And without that confirmation this rally is on thin liquidity ice as charts such as $MSFT and $AAPL are screaming for correction.
No, the bond market has been entirely consistent for decades now. Lower highs in yields and rejection at its long term trend line over and over again, a trend dating back to the early 1980s. As the world keeps accumulating ever more debt with no end in sight it can't handle higher rates, hence the consistent rejections. The Fed tries hard to avert the inevitable by coming to the rescue at each sign of trouble, but in process they keep inflating the asset bubble while failing to bring about organic reflation.
So 2020 will very much be a battle of control. Bears may be fighting the Fed, but the Fed is fighting the bond market. And nothing is bigger than the bond market. Investors may want to keep that in mind as the bond market charts signal: It's not over. Rising markets are evidence of the Fed throwing liquidity at the problem, but they are not evidence of reflation.
Commenti
Posta un commento