Shown visually, the problem roughly reduces to the following: corporate debt has doubled from $5 trillion in 2007 to $9.5 trillion halfway through 2019 with corporate debt-to-GDP now back to levels which traditionally presage a recession.

Amid this massive debt increase, the principal risk is that the biggest growth was that in BBB-rated debt (which now amounts to over $3.2 trillion), is just one downgrade away from junk, and is also why many skeptics have been warning of a barrage of "fallen angels" before or during the next recession.

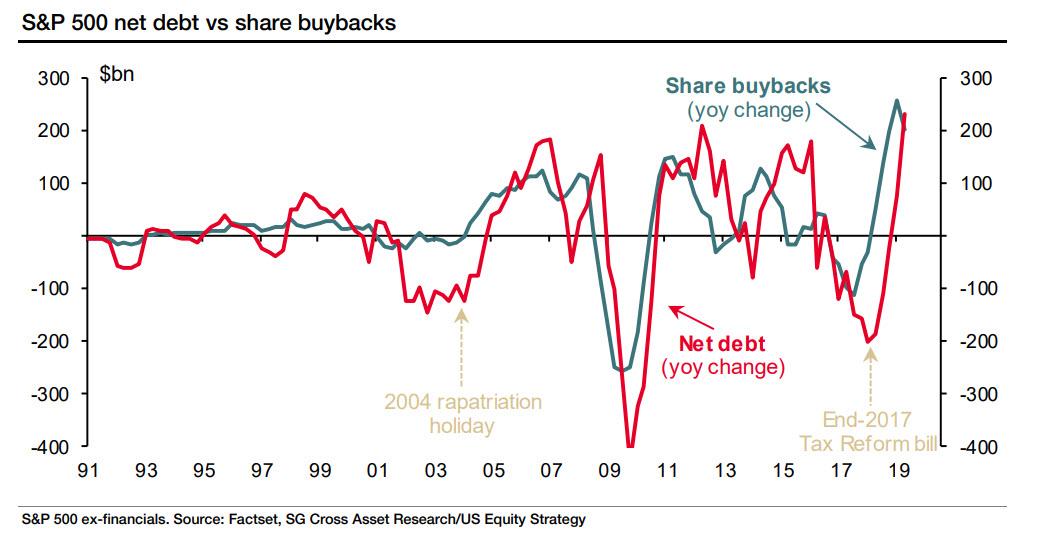
The biggest culprit for this surge: trillions in debt was sold in the past few years by BBB-rated "investment grade" companies who used the proceeds to buyback their stock...
... a concern that is only compounded by the fact that rating agencies appear to be well behind the curve, or as Morgan Stanley (and Jeff Gundlach) have shown, despite its BBB rating, 55% of BBB corps should have a junk rating already based on leverage alone.

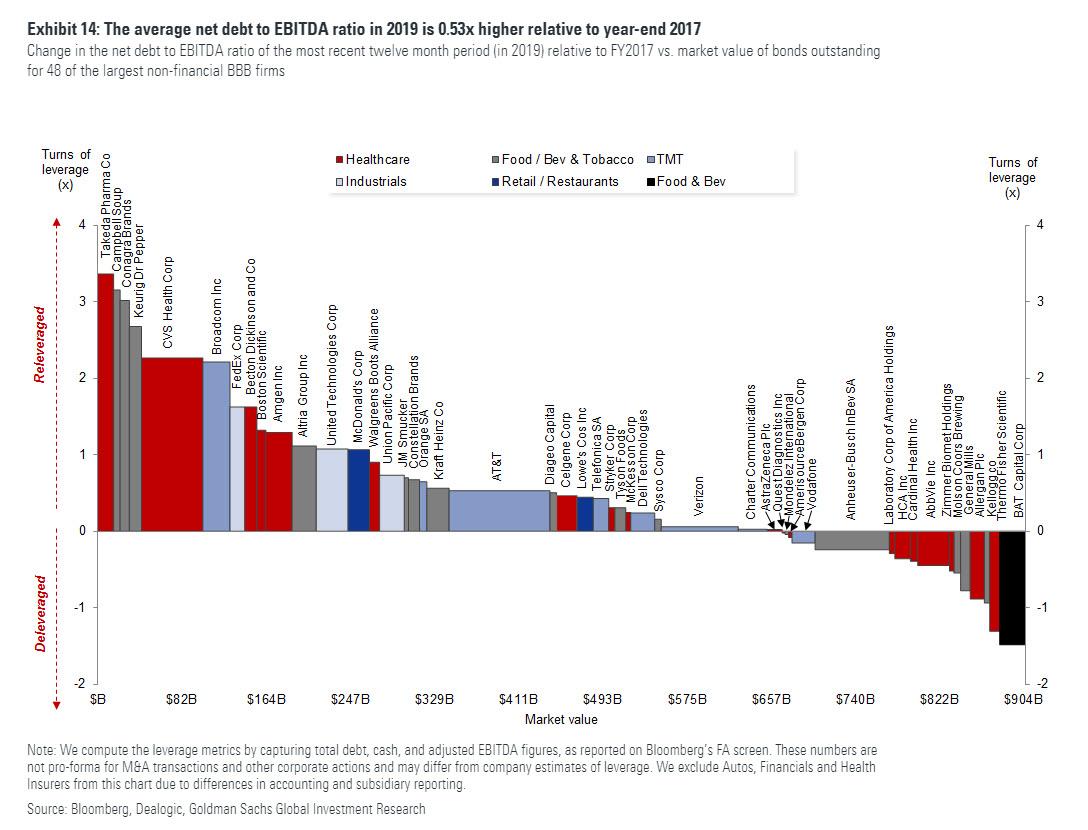
Finally, as overall corporate leverage hit record levels, for the low end of the IG rating spectrum one of the side effects of the slowdown in earnings growth has been a delay to the deleveraging plans for most issuers, despite continued commentary emphasizing a focus on gross debt pay down. In fact, according to Goldman, for 48 of the largest non-financial BBB firms – a group which captures over $900 billion of index-eligible debt across the TMT, Healthcare, Food & Beverage and Industrial sectors – the average net debt to EBITDA ratio in the most recent 12-month period (2019) is actually 0.53x higher relative to year-end 2017.
We discussed many of these dynamics, and especially the risk that much of the BBB-rated universe is far weaker than its ratings would suggest, one month ago in "Meanwhile For Bonds, It's Going From BBBad To Worse." Now, picking up on the topic of overestimated BBB-strength, is Bank of America which writes, that there are currently 26 US BBB-rated non-(Financial, Utilities and Energy) issuers (out of 198 so 13.1%) with high gross leverage (>4x), which is traditionally associated with junk bonds.
And since investor perception is that this number is much higher than in the past, and in fact some are unable to recall more than just a few examples from before 2015, one of the most frequent questions Bank of America gets is whether rating agencies are being more lenient these days - for example by giving companies credit for deleveraging plans they never fulfill? And since > 4x leverage is more apropos to high yield companies (as shown in the blue chart above) "the fear is that rating agencies getting their act together eventually leads to many downgrades to HY", according to BofA's Hans Mikkelsen.
First, some facts on GAAP vs. adjusted EBITDA
As BofA adamits, its statistic of 13.1% highly leveraged BBB companies is based on leverage defined as Debt/LTM adjusted EBITDA. However, is using GAAP EBITDA instead there are many more highly leveraged BBBs, or about a quarter of all (specifically 23.7%), as for example one-time charges can skew the numbers during the year they pass through LTM calculations.
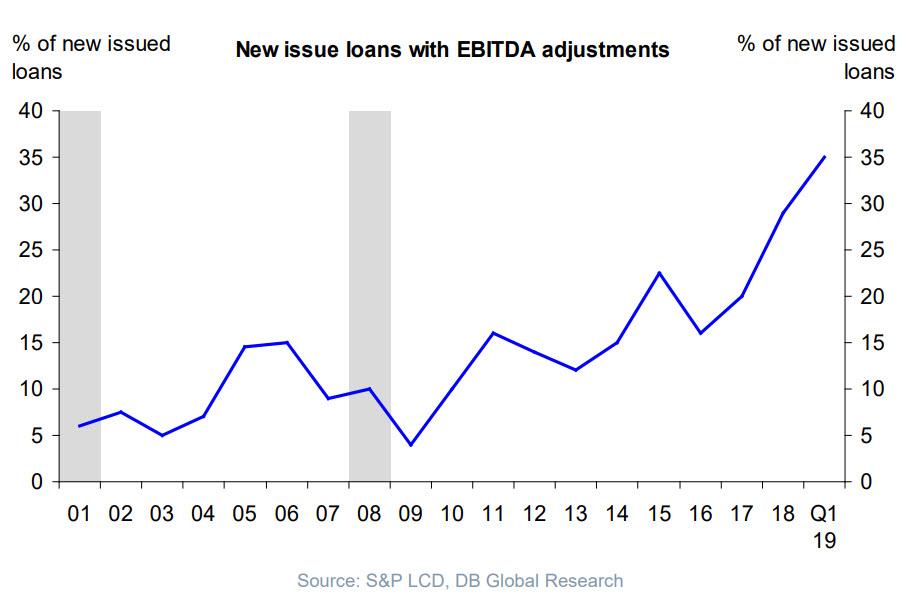
Since historically BofA only has GAAP numbers available, any comparison to current levels should be based on the adjustment-free 23.7% number. Here, if one eliminates issuers with negative EBITDA, which in IG is mostly due to one-offs, leaves 20.2% companies with >4x leverage. Which in the context of nearly $3 trillion in BBB-rated bonds is a dangerously high number if indeed up to a quarter of this is investment grade only thanks to non-GAAP EBITDA adjustments.
In any case, even assuming the more optimistic 20% number is appropriate to describe the number of 4x+ levered companies, this matches the level seen more than twenty years ago in 1Q 1998, and is why BofA says it's time to "Party Like It's 1998."
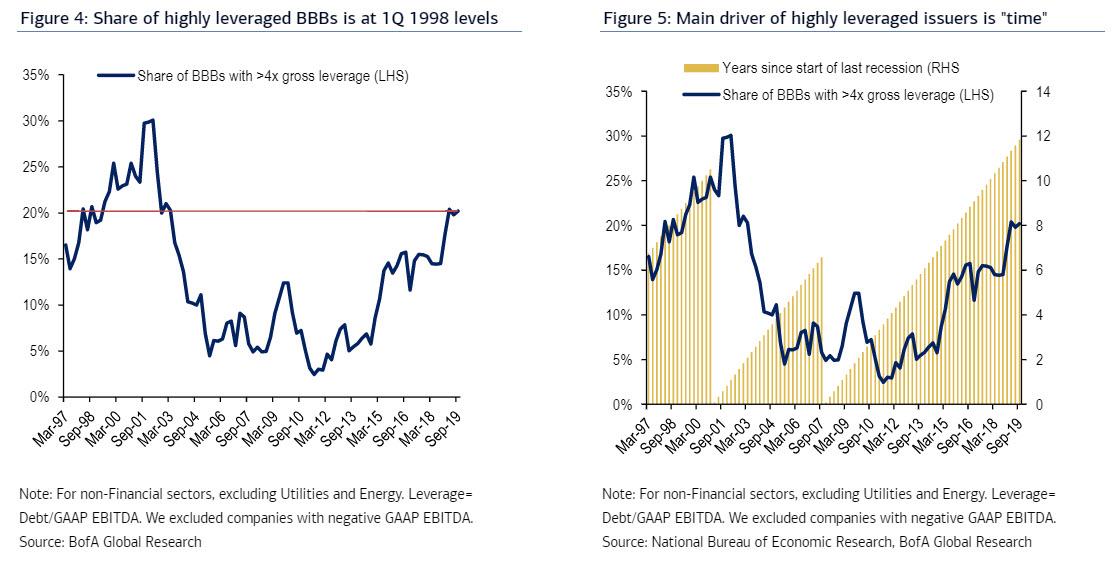
So first the good news (at least according to BofA): in terms of the cycle back then "this was exactly three years before the early-2000s recession, which timing-wise appears to us similar to where we are today." Let's also recall that that particular "expansion" culminated with the Fed's legitimate asset bubble, that of tech stocks, which we are of course seeing again with the FANGs. The outcome also wiped out roughly 80% of the Nasdaq and forced the Fed to reflate the housing bubble to offset the collapse in wealth effect as a result of the bursting of the dot com bubble.
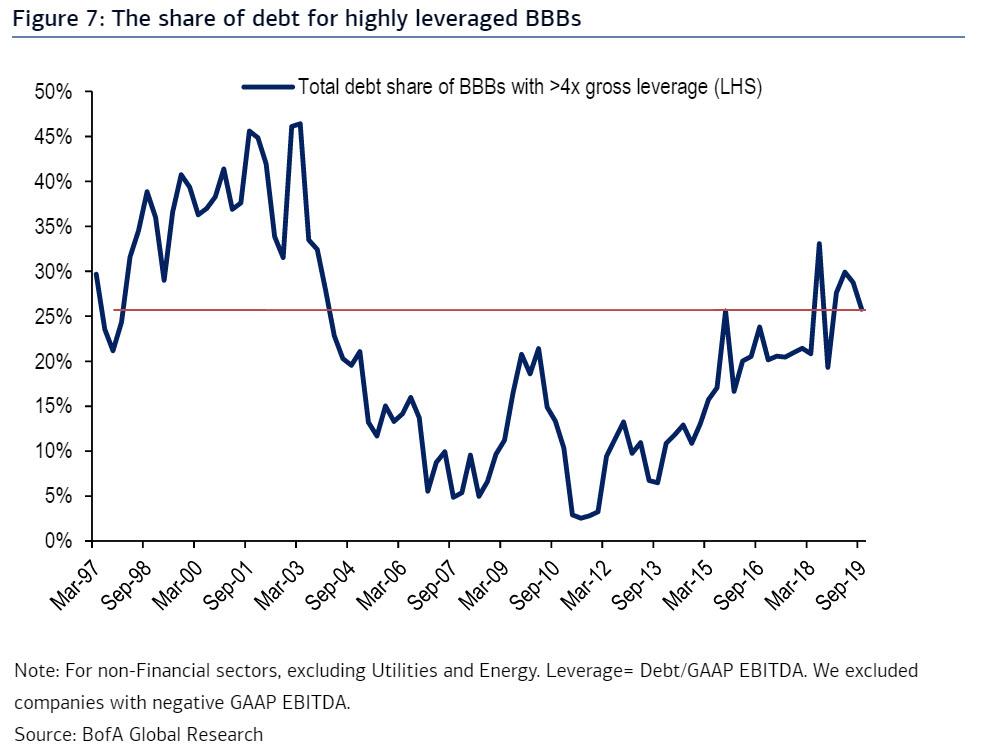
Now the not so good news: just as the 2000 bubble ended with a massive repricing of the IG space, with the number of BBB-rated companies carrying a 4x+ leverage plunged from 30% to 5% in just a few years, such a furious deleveraging by "quality" companies in the near future would lead to catastrophic consequences for risk assets. It also confirms that rating agencies are once again behind the curve, just as they were back in 1998.
Here, for all those who blame the raters for being behind the curve, BofA has a contrarian point:
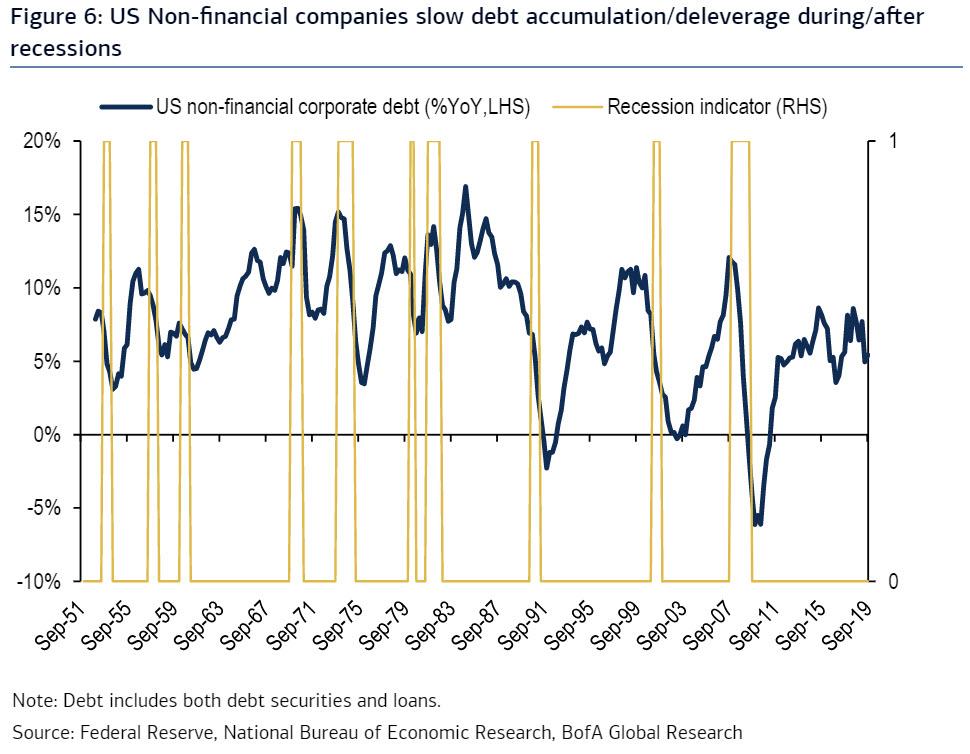
Using nearly seventy years of historical data from the Federal Reserve for all US companies we see clearly how companies increase indebtedness in expansions. This activity then slows during and in the aftermath of recessions, and the last three cycles we even saw some outright deleveraging (Figure 6). Clearly since the mid-2000s expansion was relatively short, US companies only had time to increase debt levels by 32% of pre-recession levels much less than the 83% achieved in the 1990s expansion (vs. 64% so far this expansion). With strong EBITDA growth during the mid-2000s as well there simply were not enough companies around with leverage >4x so that rating agencies could rate many BBB. This is the main reason for the low share of highly leveraged BBBs in the mid-2000s - rather than the agencies being stricter back then.
Pouring some cold water on this optimistic spin, however, is the observation that while the share of BBB issuers with high leverage is 20.2%, their share of the total gross debt is even higher at 25.8% currently (calculated in a similar way, specifically based on GAAP numbers and excluding issuers with negative LTM EBITAs). Incidentally, the share of debt was also higher back in 1998, and the current reading matches the level in 1998 (Figure 7), similar to the chart based on the share of issuer.
In short: in a best case scenario, US corporations have about 3 years before history rhymes again, and the massive corporate debt burden becomes untenable in a time of declining corporate profits, leading to the long-awaited BBBoom. The worst case scenario: the real level of EBITDA, excluding adjustments, is far lower than our worst case assumptions (which as we have shown previously can amplify the non-GAAP number by up to 200%) and even a modest change in economic conditions would result in a violent shortfall in interest coverage, a self-fulfilling prophecy where BBB-rated companies are suddenly aggressively downgraded (contrary to what had happened in the past decade), and a cascade of defaults follow unleashing the next financial crisis in the process.
Commenti
Posta un commento