Passa ai contenuti principali

Here Are The Energy Bonds Getting Crushed This Morning

With oil prices cratering by almost a third, the math is simple: junk-bond (and in some cases IG) funded shale producers, which were already cash flow negative when WTI was trading around $50, are about to become cash incineration machines and will almost certainly be forced to default in the coming months - perhaps as soon as the next interest payment, certainly by the next bond maturity which they will no longer be able to rollover as the junk bond market is now frozen - unless oil somehow stages a miraculous recovery from here.

As such, the market was focused on how shale-linked bonds will react to this weekend's oil price shock. Addressing this issue, Goldman sent an email early on Monday in which the bank made the following points for those looking at energy debt:

  1. Credit markets were having problems before the Saudi announcement, credit down when equities traded higher
  2. Significant increase in non-credit accounts looking to short the sector last week
  3. Last week saw record outflow across IG, high yield and loans
  4. Liquidity issue even more prevalent because of virus related contingency /  BCP planning

The bank concludes by noting that "although clients are better positioned than in 2015 (when had a lot of energy issuance to fund shale revolutions); expect continued selling as oil re-prices lower and the virus spreads."

That said, much of the selling appears to have already taken place this morning, with select energy bonds already in freefall as of this morning, including issues from Range Resources, SM Energy, Southerwestern Energy, Whiting Petroleum and Oxy.


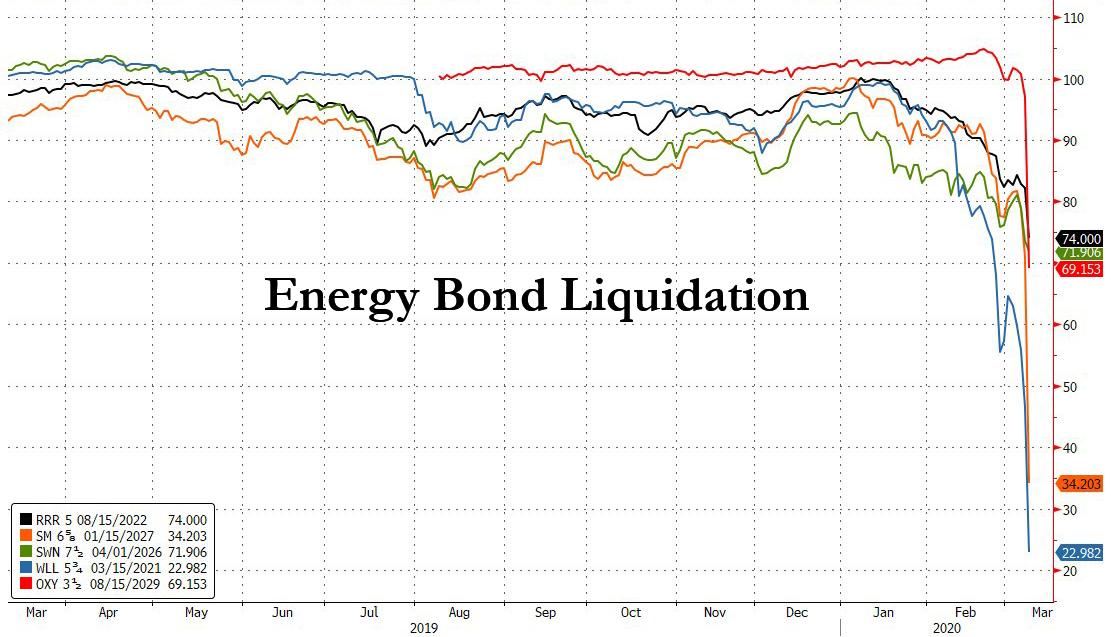
Yet despite the sudden repricing of stressed energy bonds lower, one can again note that energy credit was well ahead of the oil market, which has finally caught down to the HY Energy OAS spread.

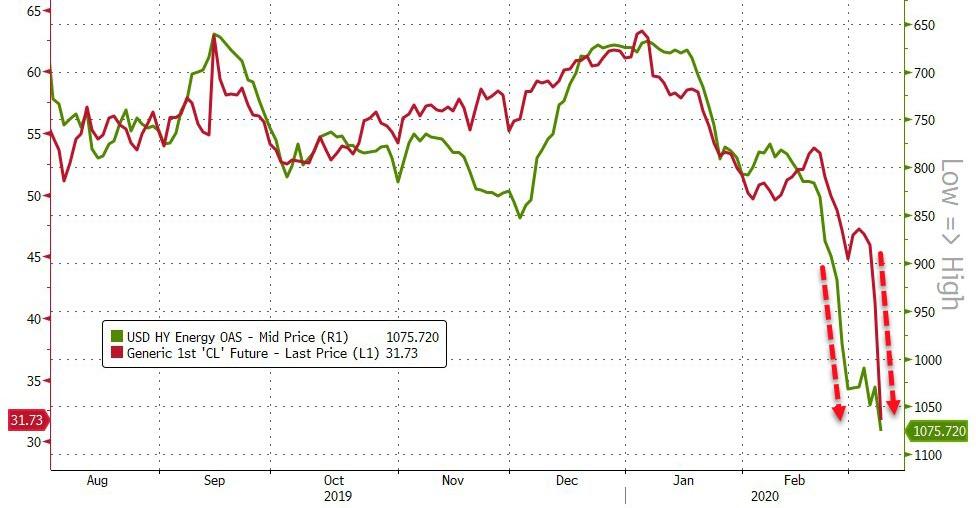
Expect many more E&P bonds to join the liquidation fray before the day is over.

Commenti

Post popolari in questo blog

Charting the World Economy: The U.S. Jobs Market Is On Fire - Bloomberg

Charting the World Economy: The U.S. Jobs Market Is On Fire - Bloomberg https://www.bloomberg.com/news/articles/2019-12-06/charting-the-world-economy-the-u-s-jobs-market-is-on-fire Charting the World Economy: The U.S. Jobs Market Is On Fire Zoe Schneeweiss Explore what's moving the global economy in the new season of the Stephanomics podcast. Subscribe via  Apple Podcast , Spotify or  Pocket Cast . The last U.S. payrolls report of the decade was a doozy, beating expectations and doing its bit to keep the consumer in good health heading into 2020. That's good news given the various pressures still weighing on global growth. Here's some of the charts that appeared on Bloomberg this week, offering a pictorial insight into the latest developments in the global economy. U.S. Advertisement Scroll to continue with content ...

Another Paradox: Consumer Spending Expectations Surge, Despite Dismal Income, Earnings

Call it the latest economic paradox. Despite widespread stories of doom and gloom about the state of US consumer finances once the fiscal stimulus bill expires on Dec 31, the latest NY Fed survey of consumer expectations unexpectedly shows that US consumers have little intention of slowing down their spending. In fact, and very paradoxically,  despite depressed and flat income and earnings growth expectations,  with median one-year ahead expected earnings growth at 2.0% for fifth consecutive month and expected income growth barely little changed at 2.14% ... ...  consumers' 1-year ahead  spending growth expectations  jumped to 3.73% over the next 12 months in November  - the highest level in more than four years, not only up from the 3.06% in the previous month but a whopping 33% more than the 2.8% reported last November,  making this the biggest Y/Y increase in expected spending in series history. This bizarre increase took place even as labor market signals were mixed: although t...

China Exports, Imports Fall Sequentially, Adding To Slowdown Fears

China's exports rose 19.3% y/y in July, missing the median consensus expectation of 20% (ranging from 15.4% to 30.7%), and declining sequentially -0.3% in July after rising +5.7% in June. Imports also rose less than expected, up 28.1% Y/Y in July, below the 33.3% median expectation, and fell 6.4% sequentially after surging +11.3% M/M in June. As a result this disproportional slowdown in imports vs exports, China's monthly trade surplus actually rose to $56.6bn in July, slightly better than the $53.3BN consensus, and up from $51.5BN in June due to the bigger miss in imports. ASEAN was China's biggest trading partner in July, followed by the Europe Union and the U.S., customs data showed. China's exports to the US grew 13.4% in July from a year ago, while imports from America rose 25.6%, leaving a trade surplus of $35.4 billion in the month. Some more details: By geography:  Export growth slowed across major export destinations, and exports to major DMs continued to be a ...