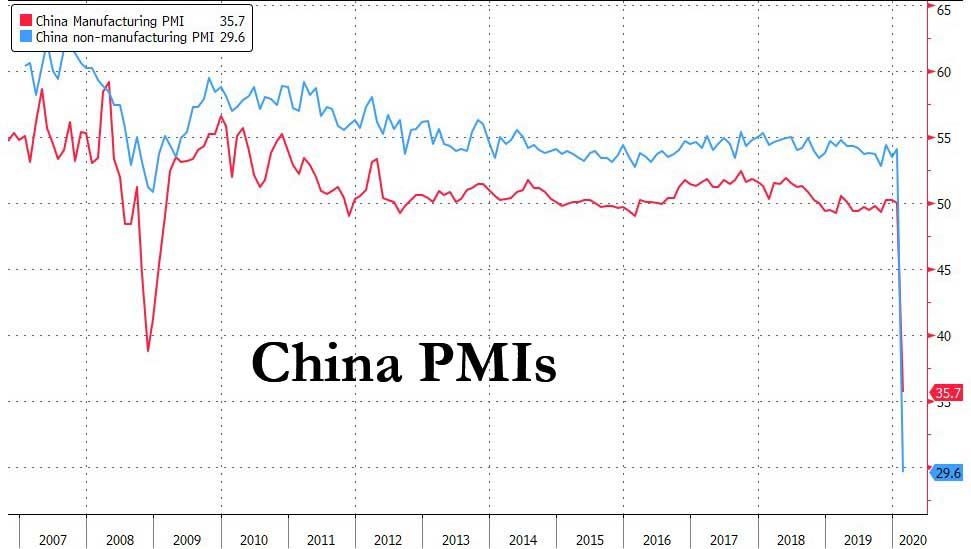
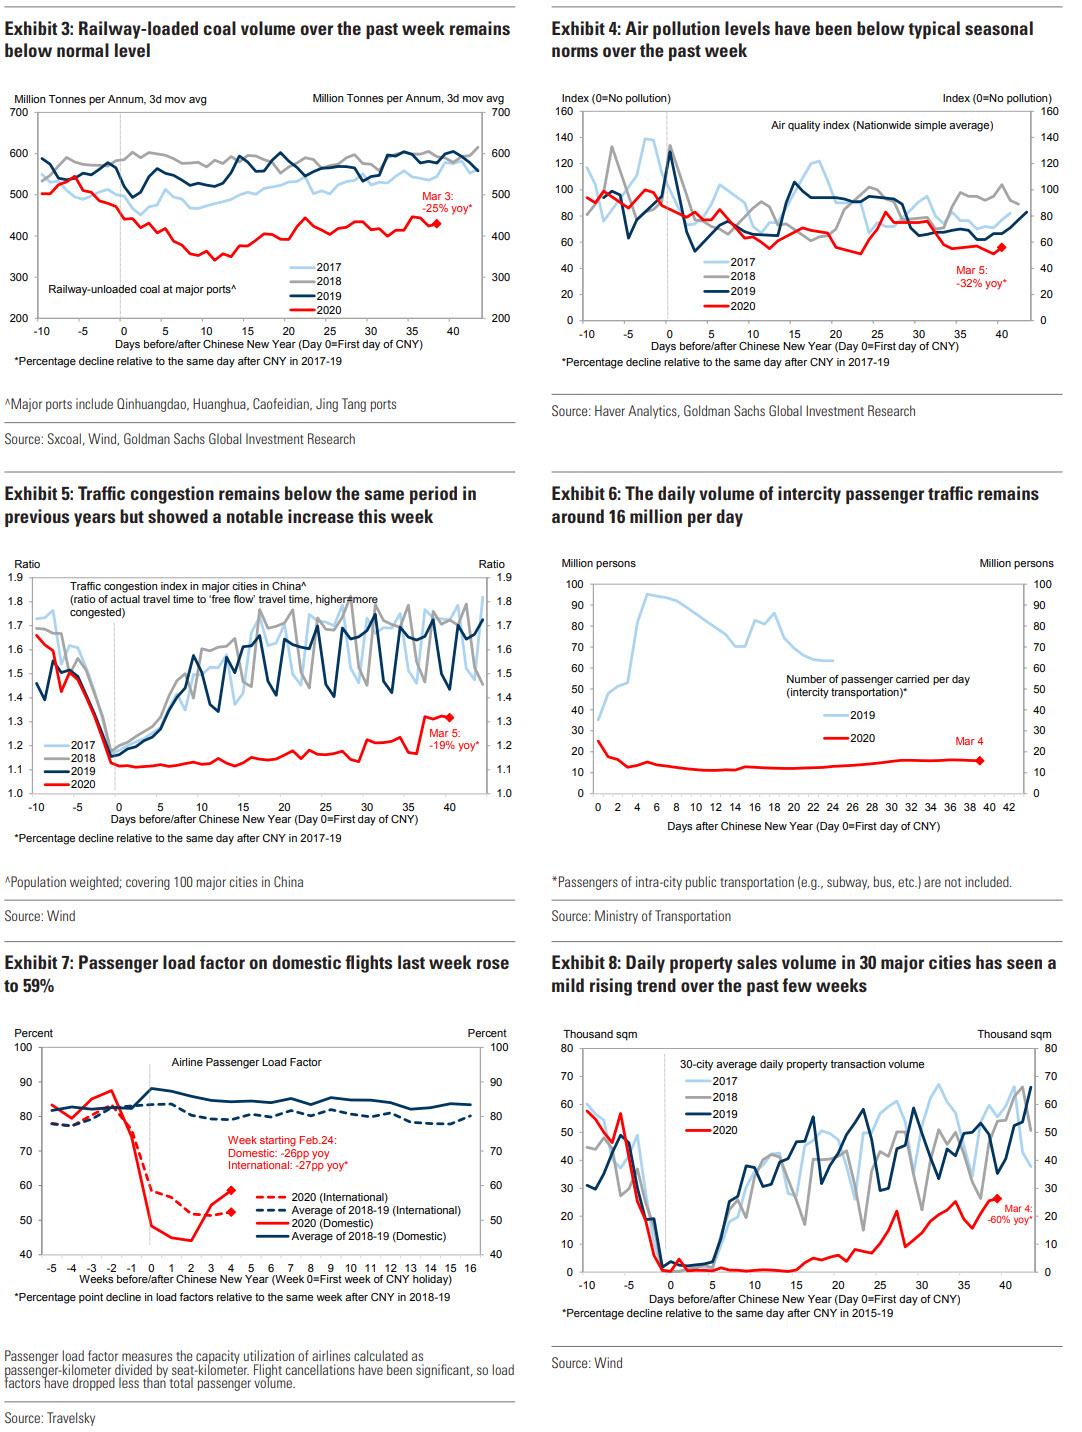
In our ongoing attempts to glean some objective insight into what is actually happening "on the ground" in the notoriously opaque China, whose economy has been hammered by the Coronavirus epidemic, in February we first showed several "alternative" economic indicators such as real-time measurements of air pollution (a proxy for industrial output), daily coal consumption (a proxy for electricity usage and manufacturing) and traffic congestion levels (a proxy for commerce and mobility), before concluding correctly that China's economy appears to have ground to a halt - the subsequent record drop in China's manufacturing and service PMI only confirmed this.
These observations were subsequently reaffirmed when we showed that steel demand, property sales, and passenger traffic had all failed to rebound from the "dead zone" hit during China's Lunar New Year hibernation.
And while the latest high-frequency Chinese data compiled by Goldman...
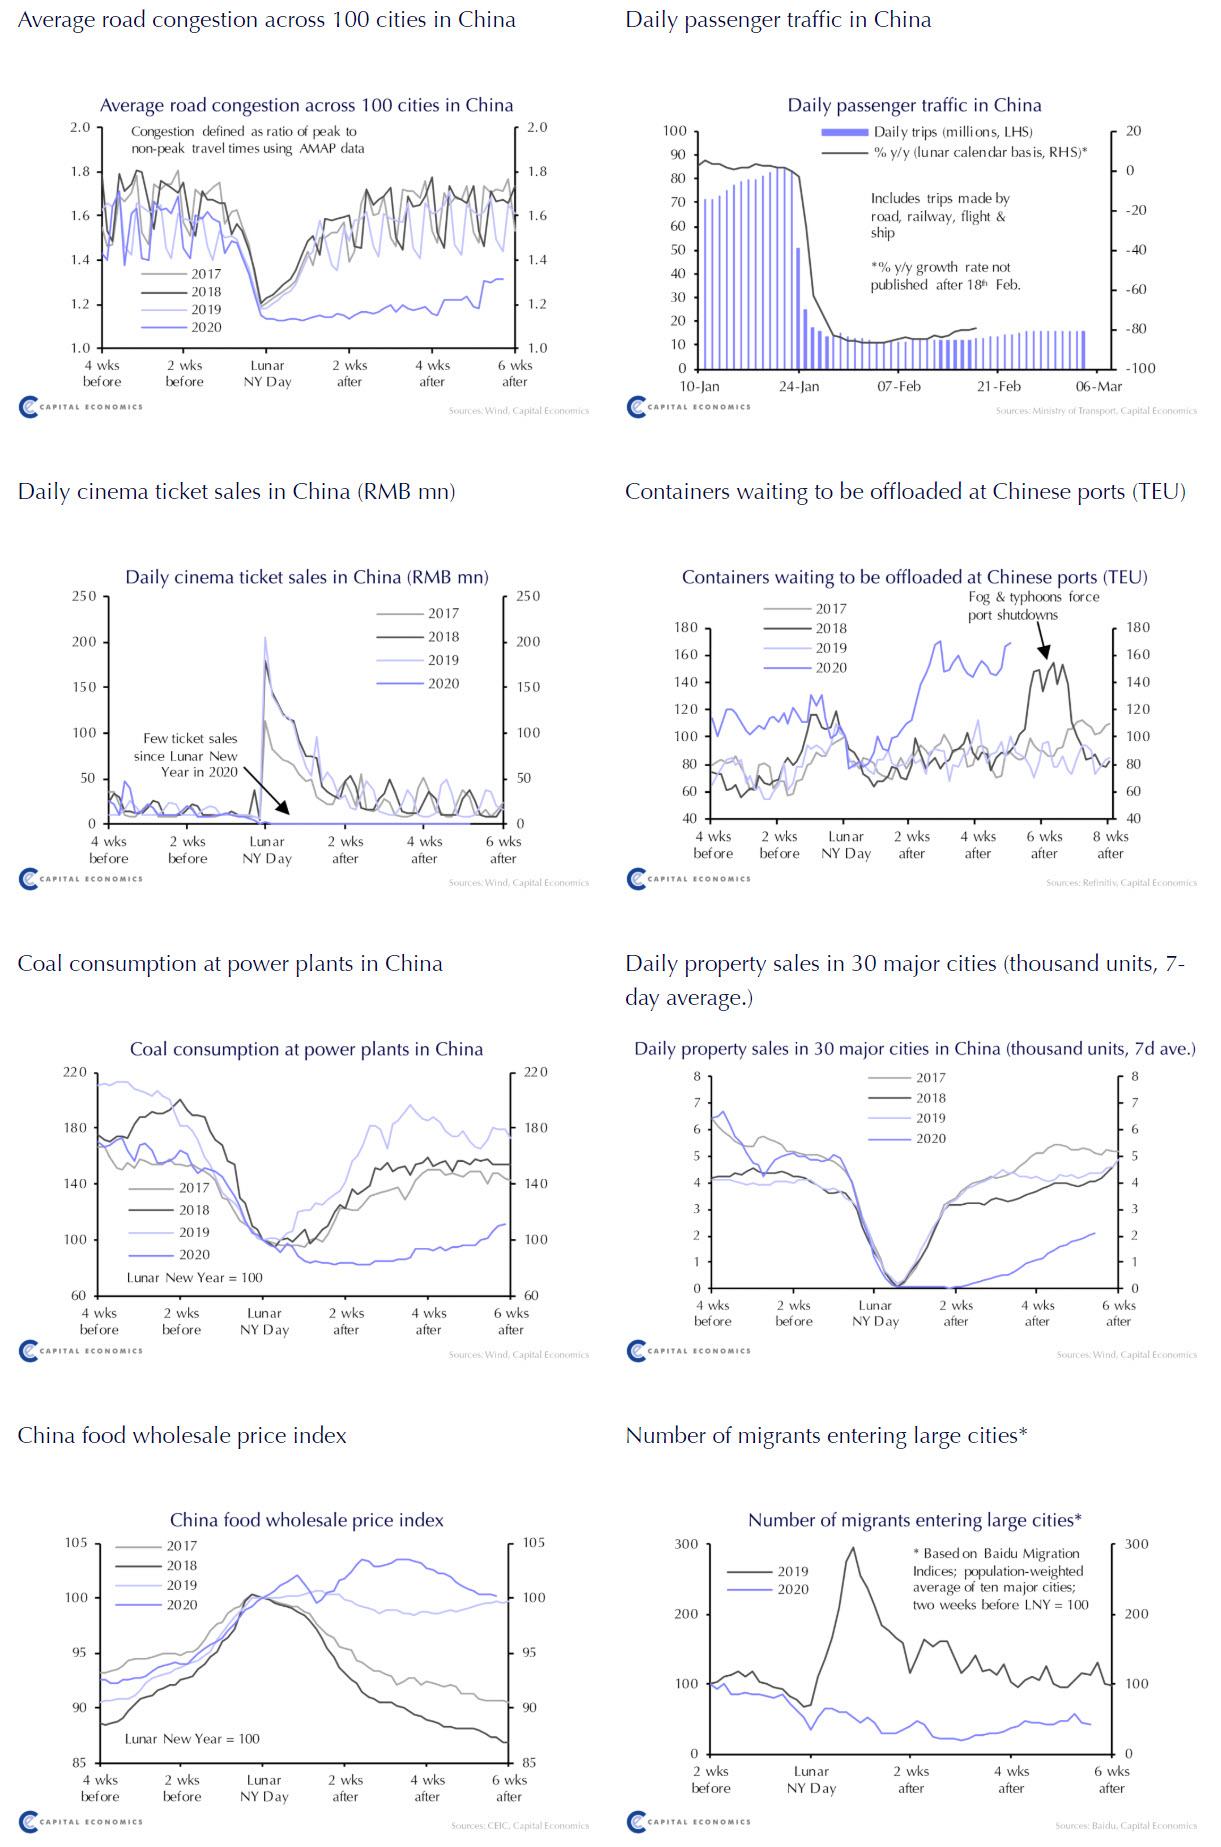
... and Capital Economics suggested there was a modest economic improvement in recent weeks...
... the latest reports that China is now openly manipulating even high-frequency data such as electricity usage to give the impression that life in China is back to normal (it isn't), have made virtually all data out of China meaningless, as explained in:
- China Orders Owners Of Closed Factories To Boost Electricity Usage, Pretend Economy Is Back To Normal
- The Lights Are On But No One's Working": How China Is Faking A Coronavirus Recovery
Yet even as China moved to openly fabricate all of its economic data, attention shifted away from China's economy and to that of the US, which is now getting directly hammered as the coronavirus is now actively and aggressively spreading within US borders. As such, while most strategist have factored in a certain slowdown from the coronavirus in the US with the assumption that there will be a V or at least U-shaped recovery, many are starting to look increasingly at high frequency data in the US... just in case the local "recovery" is L-shaped, and leading to a recession, if not a depression.
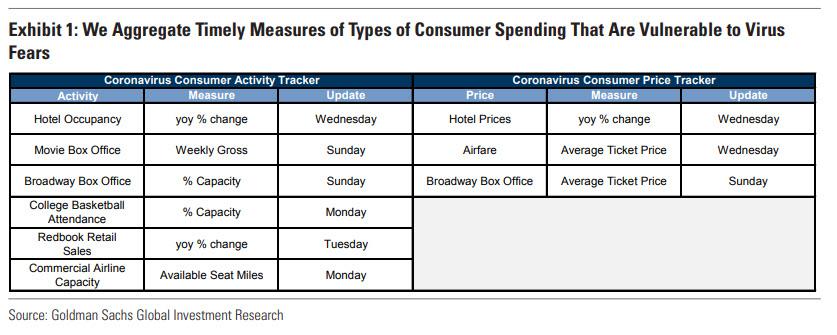
As a result, banks such as Goldman have now created some version of a "Coronavirus Consumer Activity Tracker", which in Goldman's case saggregates data such as movie ticket sales, hotel occupancy rates, and sporting event attendance, to determine if the US consumer - whose spending accounts for 70% of US GDP - is going into self-imposed spending quarantine. Separately, Goldman's Coronavirus Consumer Price Tracker aggregates data on hotel prices, airfares, and theater ticket prices, which looks at any deflationary pricing impact from the coronavirus to reveal a decline in demand if companies are slashing prices to fill empty rooms or seats.
The good news? As Goldman's Jan Hatzius writes, "our Coronavirus Consumer Activity and Price Trackers show no sign yet that virus fears have led to consumption cutbacks. Going forward, we will provide regular updates of these new indices to track the impact of the coronavirus outbreak on the most vulnerable categories of spending."
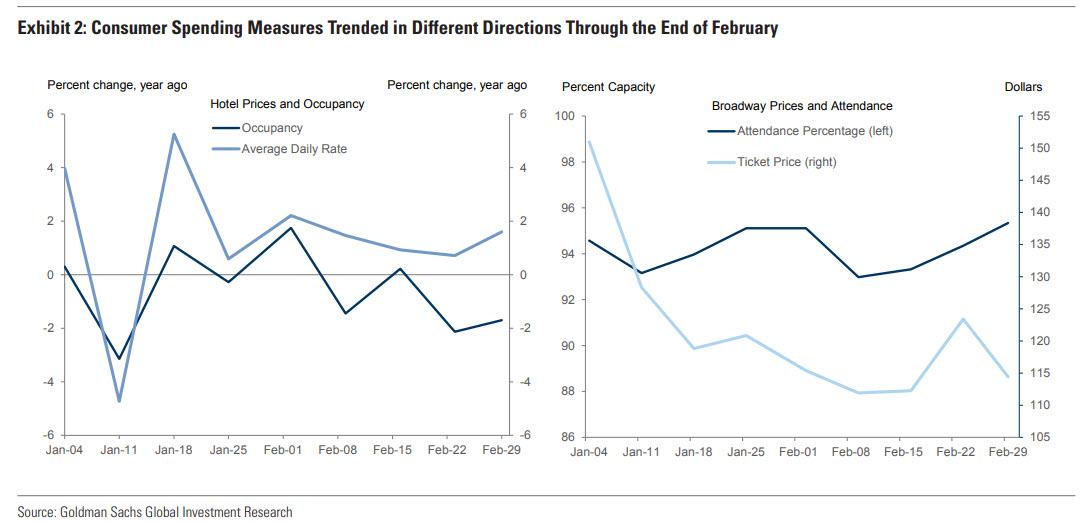
The next chart illustrates some of the Goldman data. The left chart presents year-over-year changes in hotel occupancy rates and prices. The right chart presents the average attendance percentage and ticket price for Broadway shows.
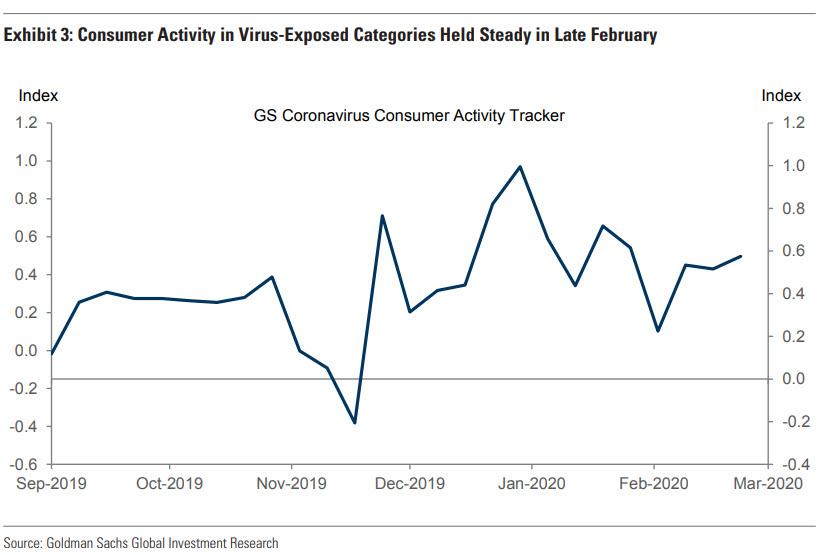
The bank then aggregates the data into two indices that summarize overall signals for consumer activity and prices, the GS Coronavirus Consumer Activity Tracker and GS Coronavirus Consumer Price Tracker.
The next chart presents Goldman's Coronavirus Consumer Activity Tracker. Consumer activity in virus-exposed categories held steady during the last week of February, as declines in Broadway attendance, movie ticket sales, and available airline seat miles were offset by increases in hotel occupancy rates, retail sales, and college basketball attendance. "This suggests that, at least for now, consumers aren't avoiding mass gatherings in response to the coronavirus news", according to Goldman, although as we will show later, not all data agrees.
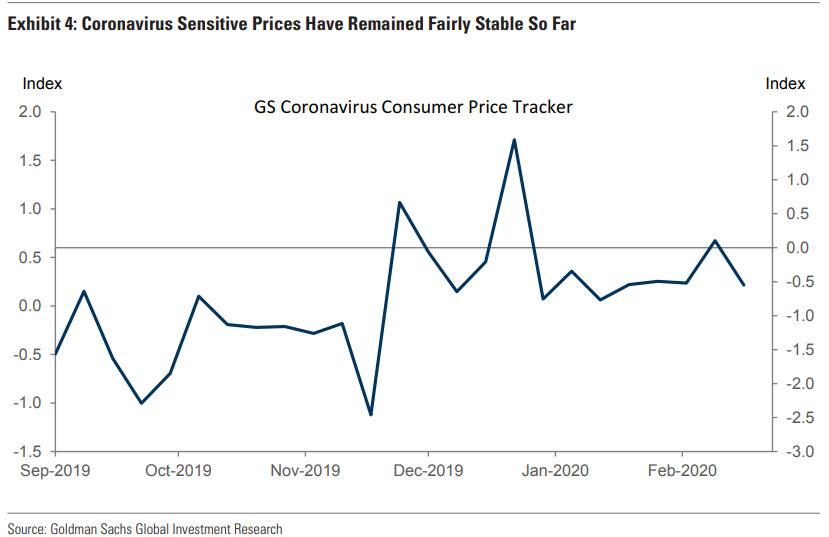
The next chart presents Goldman's Coronavirus Consumer Price Tracker, which provides another measure of consumer demand. This index also remained roughly in line with its recent average last week, as small declines in airfares and Broadway ticket prices were offset by an increase in hotel rates.
The bottom line from GOldman: "While activity in some of these categories declined last week, our Coronavirus Consumer Activity and Price Trackers show no sign that virus fears led to consumer cutbacks through the end of February."
* * *
Taking a step back, why do we care about US consumer spending in the context of the coronavirus? Recall that there are two distinct channels by which COVID-19 filters into the US:
- direct link through global supply chain disruptions; and
- indirect through a confidence shock.
The former is already in play and is very likely to create challenges for multinational companies in the US into the summer. The latter is being threatened given the violent sell-off in markets and warning from the CDC about the inevitability of the disease showing up on our shores.
It will take time for the "hard" economic data to show the impact but we are already seeing evidence in early economic indicators including:
- corporate commentary about broken supply chains,
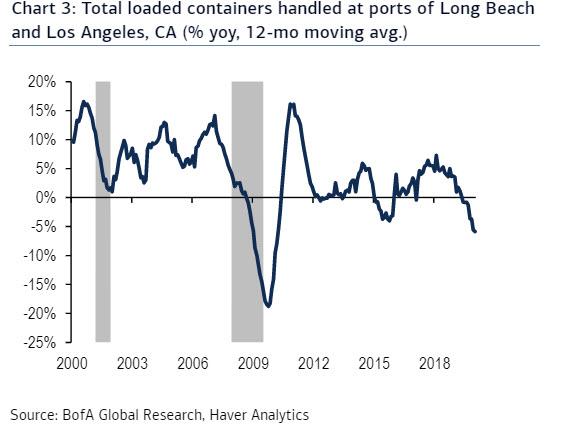
- stalling in port activities,
- deterioration in financial conditions,
- freezing up in corporate debt issuance and behavioral shifts among consumers which we observe in our proprietary consumer data.
Courtesy of Bank of America, we look at each of these in further detail below:
The global supply chain was already under pressure as a result of the US-China trade war and the coronavirus adds additional strains. The tariffs created frictions by increasing the cost of production but the virus threatens to be a large supply shock by impairing the ability to produce. For example, take a US retailer who is importing textiles from China which will then be sent to a factory in Southeast Asia and then perhaps back to China to make the end product. If the retailer cannot receive the raw materials - which in this example is textiles - it shuts down the entire process. And this example is way too simple. The reality is that these are complex cross-national supply chains with large secondary impacts, and, as Goldman recently warned, "the supply chain effect is likely nonlinear with the length of the outbreak, as production is likely to remain largely unaffected until inventories run out, after which production may fall sharply."
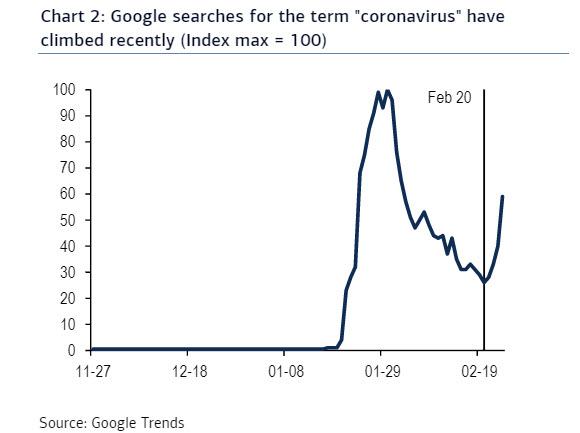
Companies are already vocal about these challenges. According to Bank of America economists, over 180 companies have mentioned the virus on earnings calls, with those in the consumer discretionary sector being the most negative. Similarly, a FactSet search of 364 earnings calls from January 1 through February 13 found that 38% included the term "coronavirus" at least once with the industrial, IT and healthcare sectors accounting for the majority. And this is as of February 13th - consider how much worse it likely has become since then. We can get a sense from Google Trends: searches for "coronavirus" in the US fell in the early parts of February but have recently been climbing again as the virus spreads to other countries.
We can also look at activity at US ports.According to press reports, cargo traffic through Port of Los Angeles is down about 25% in February as China accounts for about half of LA port's traffic. Port traffic had already been trending lower in ports across the west coast for much of last year owing in part to the trade war that led to a decline in trade between the US and China. As a result, BofA sees inventory shortages accelerating over the next few weeks given the 12 to 27 day sailing time between Asia and the US.
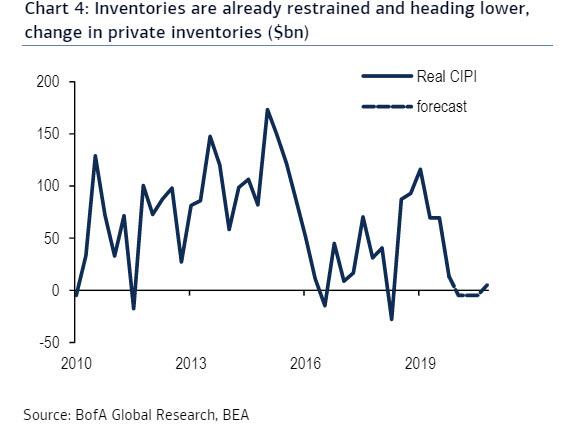
From a GDP perspective, the drag from broken supply chains will be evident in weaker business investment, mostly in inventory but also capex. Inventory levels ended last year low, which means the starting point is troublesome. We expect inventories to contract for the first 3 quarters of 2020- it is atypical to see such inventory reduction outside of recessions. The silver lining is that once we get to the other side and the recovery begins, there will be a need for restocking which will support growth.
Of course, if such relationships were linear this would more or less cover all the issue. However, since supply chains are non-linear and reflexive, they form adverse feedback, and as BofA warns "adverse feedback loops are dangerous."
Not only that, but as the bank's economists warn, "we are starting to see evidence of an adverse feedback loop between markets and consumers; this frightens us." Let's review the signals:
Market indications:
- As of Friday, the S&P 500 sold off almost 14.0% from the recent high.
- The 3mo-10yr yield curve is inverted by ~18bp, the most since October 2019 when trade war concerns were dominating the news flow
- BofA's global financial stress indicator triggered risk-off for the first time since August 5 - September 12 2019. While the indicator has been a good signal to buy the dip since 2013, the bank's equity derivatives research team warns that this time may be different given the nature of this shock.
- Freeze in the global credit machine. In the US, high yield bond issuance has slowed and there was no new US IG corporate issuance this week.
Consumer signs:
In the bank's proprietary consumer survey, BofA has seen some pickup in those noting they are "very concerned" though it remains modest. And while broad consumer sentiment has been resilient, as Goldman's data confirmed, this will change drastically in the coming weeks.

But most notably, and countering Goldman's far more benign data, based on BofA's internal credit and debit card data, behavior has started to shift. The first obvious change was in spending on Asian airlines, which has plunged. Subsequent data has revealed that spending on European airlines, cruise lines, and lodging has all crashed compared to 2019. What has remained resilient so far, is spending on health and personal care stores, as well as spending at grocery stores. If and when there is a decisive pullback across all spending categories, "we suggest you panic."

The conclusion: so far US consumers haven't showed broad-based fear. But as BofA reminds us, consumers are very sensitive to big market moves. Case in point: consumer confidence tumbled following the sell-off in December 2018. Similarly confidence weakened following the big market move in August 2019. In both cases spending plunged immediately thereafter. This is more than simply a negative "wealth effect". Consumers see the stock market as a gauge of the health of the economy and the state of their personal finances; it is also an indicator of faith in the Fed which has single-handedly kept the stock market ramping for the past 11 years, avoiding both a bear market and a recession. Which is why when the stock market sells off violently, it sends an ominous message.
We leave the last words to Bank of America: "We believe that we are in the very early stages of the adverse feedback loop. In our baseline forecast, we are assuming that it does not spiral. However, it remains a significant risk and we believe it is prudent to monitor it very closely."
--
Commenti
Posta un commento