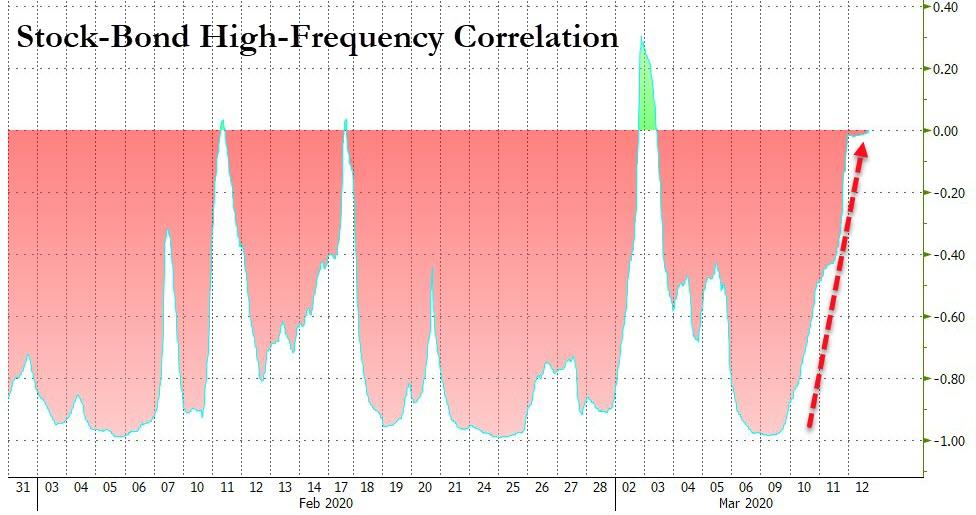
As Morgan Stanley notes, there are signs of a breakdown in stock-bond correlation, with stocks underperforming 10-year yields by nearly 5 standard deviations yesterday. This puts stress on all multi-asset portfolios, but Risk Parity funds in particular are likely struggling, having the worst 3 day period on record...
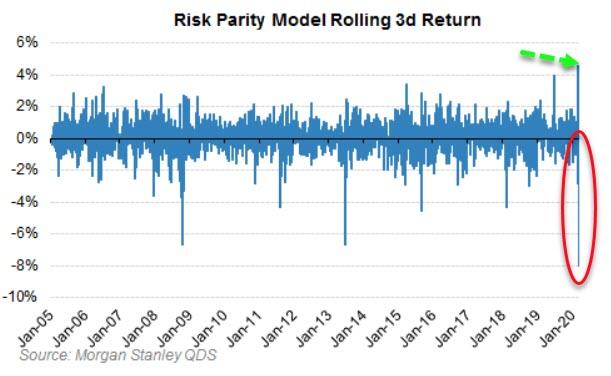
As a reminder, Risk Parity funds are the class of the systematic strategies that are likely still running high leverage – 50th %ile since 2012 and 70th %ile since 2005 on QDS's model.
This means they could have $10bn or more of stock to sell/day in these kinds of environments – and since they often will be selling stocks and bonds together, their flow can reinforce correlation breakdowns like we are seeing here.
Also note that a stock-bond correlation breakdown can also threaten many consensus equity trades, and potentially could force the long awaited L/S degrossing. Lower stocks can put pressure on the long (Growth/Tech) side of portfolios while higher rates gives some support to the short (Cyclical/Value) side of books.
In other words, the Risk-Parity-forced-delevering "tail" can very much wag the whole market's "dog" - and that is what we are seeing this week.
* * *
As we detailed yesterday, the selloff was painful, violent, unrelenting... but it was mostly order and made complete sense: stocks were getting liquidated with the bathwater by formerly euphoric investors, with the resulting proceeds shoveled into safe-havens such as Treasurys which helped send the 10Y yield as low as 0.31% on Monday morning as countless Treasury shorts - all those who had listened to JPMorgan - got crushed. However, today something changed.
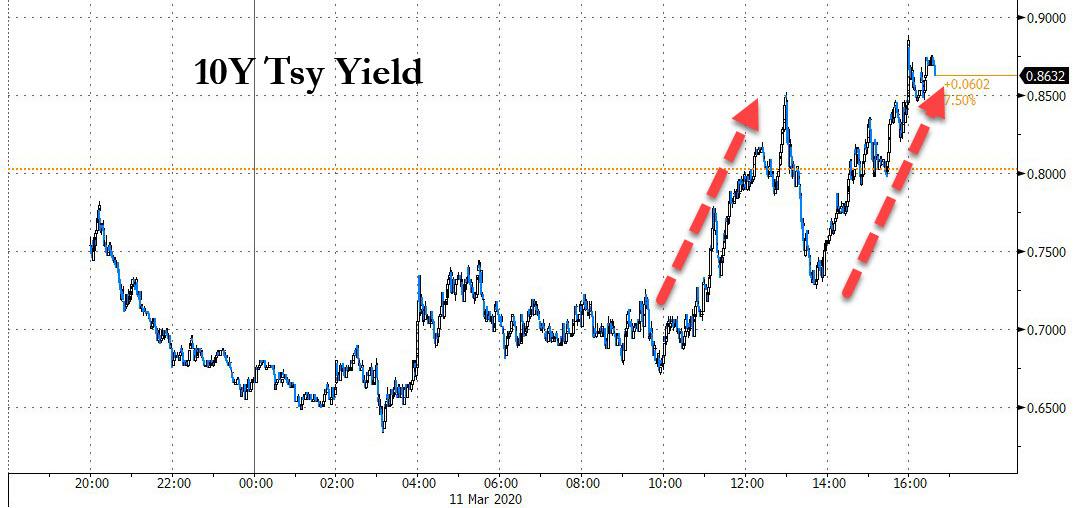
After initially bonds were strongly bid for much of the Asian, European and morning US session, there was a sharp reversal before Europe closed for the day, with 10Y yields blowing out from a low of 0.65% around the time Europe opened, to a high of 0.85% by the European close, then following a modest dip, the selling resumed, sending the 10Y just shy of 0.90%.
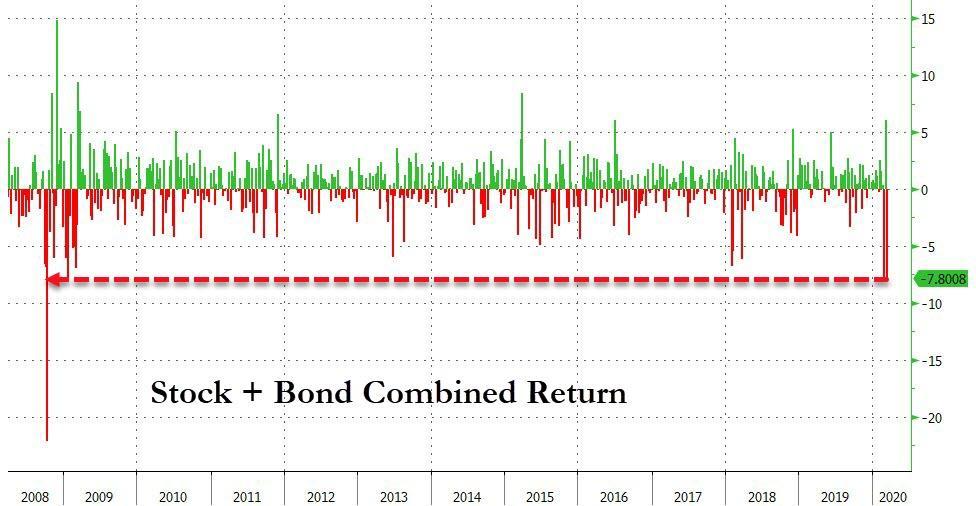
Immediately, unfounded theories emerged: a risk parity fund was deleveraging and blowing out of both bonds and stocks; oil exporters were dumping TSYs to obtain cash amid the price plunge in crude, bond vigilantes fuming at the upcoming coronavirus-driven budget deficit explosion, a fund was margin called and liquidated all of its best performing assets. The truth is nobody knows what caused it, but the puke in both stocks and bonds raised quite a few eyebrows, while hammering 60/40 balanced fund returns, generating the biggest weekly total return drop in a combined stock & bond portfolio since Lehman.
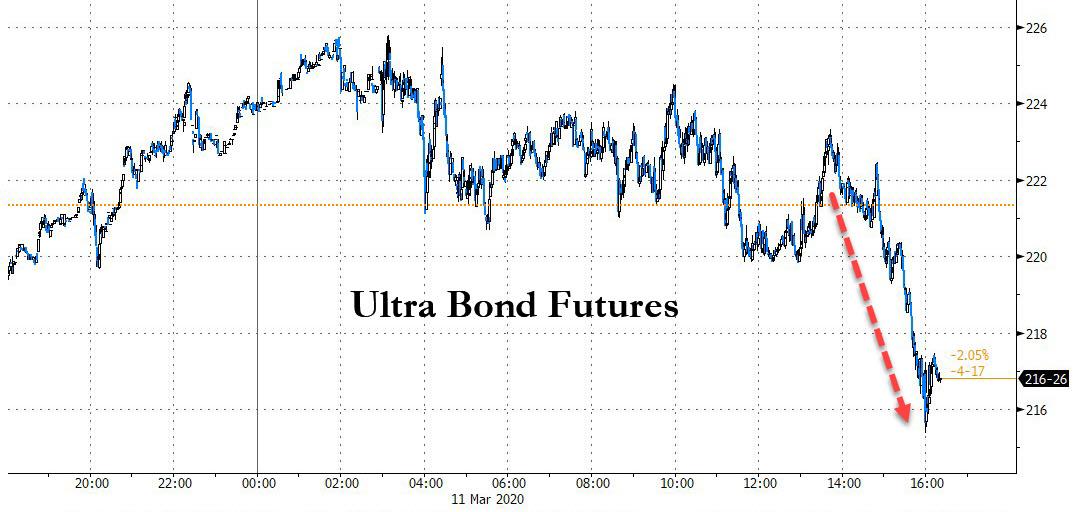
What is perhaps just as notable, is that whoever was puking duration did so until the very close with an accelerating liquidation and erratic futures price action observed in the late U.S. afternoon and peaking by 4pm, when the ultra-long bond futures plunged nearly 6 points in less than an hour - an unprecedented move - and the Ultra contract closed well in the red even as stocks crashed into a bear market.
Was today's bizarre balanced portfolio unwind a one-time event, or have forced liquidations finally made it to risk parity funds? We'll know tomorrow, if not overnight, but if for whatever reason US Treasurys are no longer a safe haven if one or more forced sellers are set to drag prices lower, then watch as the real safe haven - gold - jumps above its all time high on very short notice.
Commenti
Posta un commento