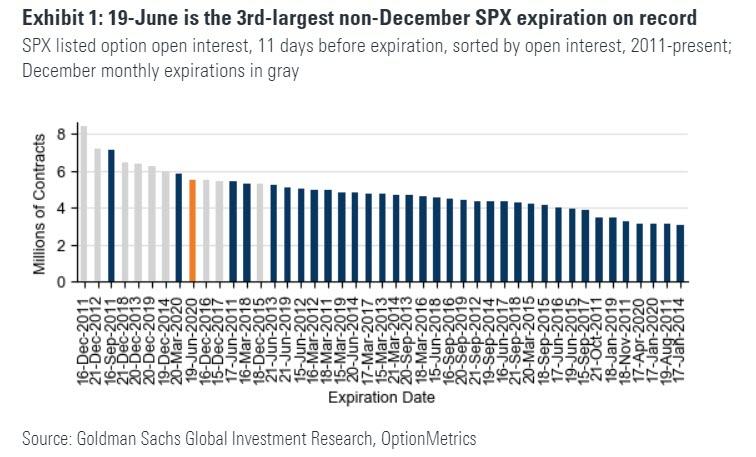
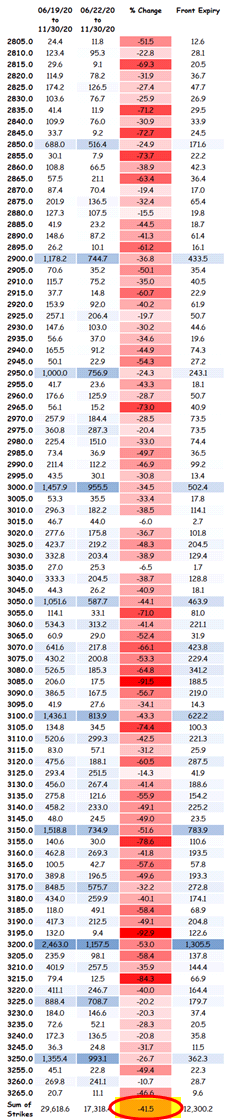
In our preview of tomorrow's massive, $1.8 trillion op-ex, which will be the third-largest non-December expiration on record, we quoted Goldman who said that as a result of a substantial amount of the open interest located below spot (largest concentration is at 2800-2900) "it is not immediately clear if this alone will have a material move on the market in the immediately preceding period", and also whether this impact would be bullish or bearish.
So if Goldman is correct, tomorrow's should be generally a non-event. But what about after?
According to Nomura's Charlie McElligott, "the short-term setup for an SPX pullback coming out of tomorrow's Op-Ex is there, particularly as we see a "clustering" of the CTA deleveraging- and Dealer Gamma- levels not far below market into next t+1w / t+2w relative to spot—which then aligns with seasonal propensity to pull-back post the serial expiration."
Picking up where Goldman left off, the Nomura quant notes that as a result of a growing number of election-based trades, "forward equity vol remains "sticky" higher, as does VVIX—with many folks noting "spot up, vol up" in general this week, as we've turned a bit "gappier" again and witnessed a pick-up in tails have been increasingly bid (certainly in popular singles like AMZN and TSLA where 25d call to atm skew is >90th %Ile)." As a result, trader focus is surrounding the "grab into index upside calls (skew recently coming-off in shorter-dated tenors, implying FOMO-chasing), which could push Dealers "short gamma" into a blowoff."
Does this mean that Goldman's assessment of where peak gamma is tomorrow is wrong? Here is McElligott:
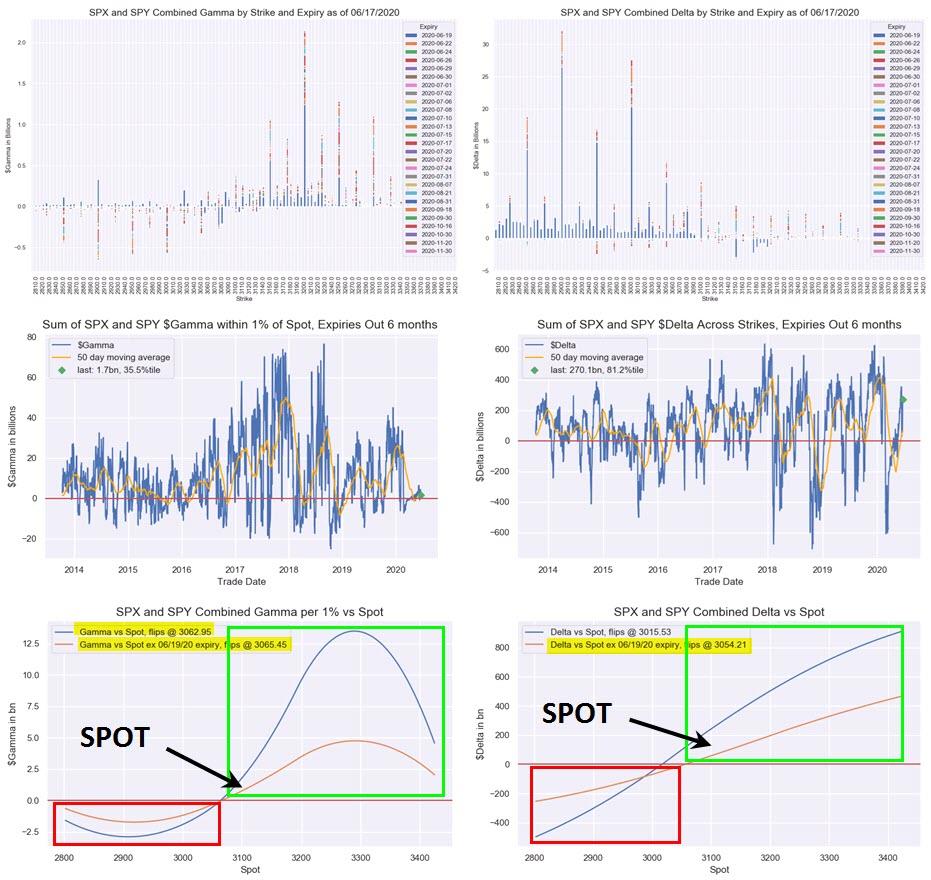
Thus, there is certainly more opacity to the "true" nature of the Street Gamma profile into this always-significant June serial / qtrly Op-Ex…although the way we keep sticky around this 3100-3150 level lends me to believe that the overall Dealer profile remains "moderately long- to neutral- Gamma"
On the other hand, as noted yesterday and as McElligott himself has noted in his discussions of the June Op-Ex, despite the absolute notional rank being rather low at just 36th %ile since 2013, there is a particularly large %age amount of this aggregate $Gamma set to drop-off, with our latest estimates showing nearly a 42% decline once the front expiry clears, which to the Nomura strategist suggests there is "a meaningfully larger "drop-off" than standard expiries in the ~upper teens-20% range and serials being 30%'s."
What does this mean for the market coming in and out of Friday? To Nomura, this suggest that the S&P is qualitatively open to a (short-term) move lower for the following reasons:
- The Overwriter rolling of options impact disappears;
- The Corporate "buyback blackout" synchs on the calendar next few weeks as well;
- The overlapping into likely qtr-/month- end Pension Rebalancing flows out of stocks (something we discussed yesterday with Goldman forecasting $76BN of selling), into bonds on account of the recent performance disparity. Charlie also notes that the internals of the S&P June 2020 rebalance are thematically "Defensive"—Healthcare, Utes, REITS and Capital Goods the largest "buys" vs Banks, Div Fins, Transports, Materials and Tech Hardware / Semis for "sale".
Furthermore, the "look-ahead" shows that there is some notable "clustering" of levels in S&P futures nearing and into the next week+ on any potential pullback.
![]()
And while there may not be a decisive gamma breach point, another possible selling trigger may come from trend-followers as currently when projecting out t+10d in the Nomura CTA model, the bank sees 3050-3070 as the next range of "trigger" levels for potential deleveraging from the current "+100% Long" in the S&P futures position, as the signal would tilt "less long" (3050 today and tomorrow assuming today's return = 0, with trigger moving incrementally higher in the week + thereafter).
Friday's op-ex aside, McElligott finally looks at consolidated SPX / SPY options data, where he sees that the above mentioned 3050-3070 range is also where we see Dealer "Gamma vs Spot" position flip at 3062 for today, or 3065 post this week's expiry, "and similarly the "Delta vs Spot" position flips lower today seemingly deeper otm at 3015, but not too far below current spot at 3054 post this week's expiry."
Commenti
Posta un commento