"Either the well was very deep, or she fell very slowly, for she had plenty of time as she went down to look about her and to wonder what was going to happen next."
- Lewis Carroll,Alice's Adventures in Wonderland / Through the Looking-Glass
Tapering Paradox

Over the past week or so, a few Federal Reserve officials have begun to say that "tapering" its quantitative easing program could occur in late 2021.
While on many levels this seems to be a bit of wishful thinking, it is worth exploring what that actually means.
In the summer of 2013, Ben Bernanke signaled tapering would occur in the fall. That became known as the "taper tantrum" as yields moved higher and the dollar strengthened.
But - as it turns out - the actual tapering in January 2014 did not see a rise in long rates. Instead, long rates were pressured for the next couple years.
As it turns out, rhetoric of a taper is far more powerful than the act of a taper. Currently, it is the rhetoric phase. That should not be forgotten.
Quantitative easing - the Federal Reserve's purchases on U.S. Treasuries and Mortgages and other securities - is a powerful tool. And - long with the traditional fed funds rate - "QE" has become one of the Fed's favorite tools to combat crises.
Recently, there have been rumblings from Fed officials that QE could be "tapered" (reducing the dollar amount purchased month to month). While somewhat odd (the U.S. unemployment rate stalling at 6.7% and elevated levels of non-participants in the labor market), understanding the likely consequences of this rhetoric and an actual tapering of QE is useful.
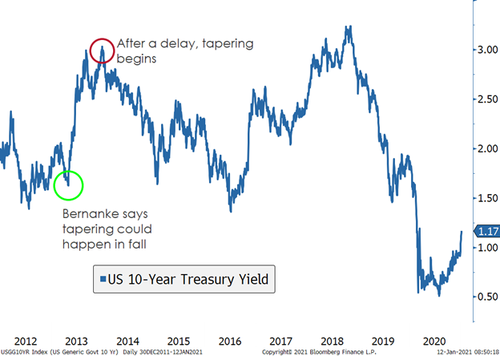
The "taper tantrum" of 2013 provides a bit of perspective. In testimony before congress, then Fed Chair Ben Bernanke stated QE was likely to be tapered in the fall. Yields rapidly moved higher higher (as did the U.S. dollar).
This shock to the system caused the Fed to back away from its plan to taper bond purchases in September 2013 to January 2014.
As it turns out, yields peaked as the taper began and continued to fall for the better part of two years as the Fed halted purchases.
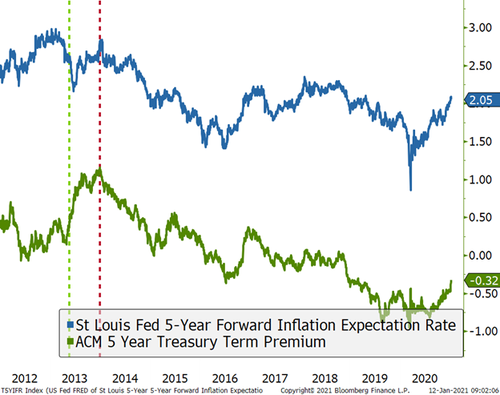
This seems paradoxical. The Fed slowly stopped buying billions in bonds, and bond prices rose and yields fell. But on a deeper level it makes sense. QE is a powerful tool, because it boosts confidence in positive economic outcomes. This boosts "term premium" or the compensation investors demand for holding bonds over time due to the risk of higher rates. Positive economic outcomes tend to increase interest rates. Not to be overlooked, liquidity being added to the system boosts the outlook for inflation too.
When the Fed stopped doing so in 2013, these measures began a persistent decline. The likelihood of better than expected economic data faded, and inflation was no longer expected to move higher in a meaningful way. Hence, longer-term interest rates (most sensitive to economic outcomes) declined.
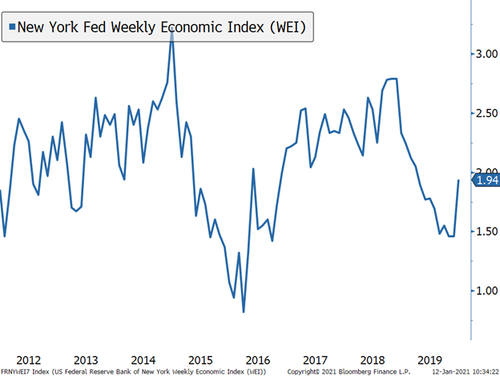
Importantly, the majority of 2014 saw fairly robust growth that continued into 2015. In other words, yields were falling back before economic growth sputtered. The move lower was accentuated - but not started - by slowing economic growth. Simply, the Fed changed the outlook for yields by removing a critical support for yields, not prices.
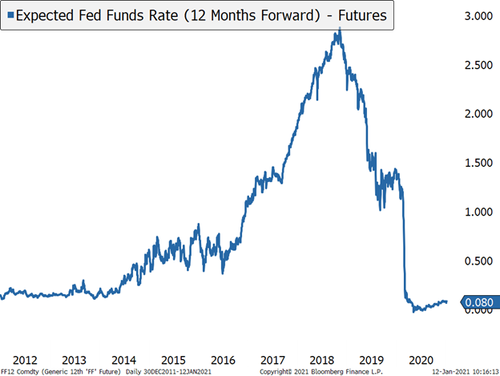
All the talk around a taper is strange. One of the tools the Fed has been trying to exploit is "forward guidance" - the ability to succinctly and clearly communicate its monetary policy well into the future. It is a "cheap" policy tool as long as market participants believe what you say. All the rhetoric of a tapering risks pulling forward expectations for a rate hike as well. That is not something the Fed is keen to do.
The critical part of the taper rhetoric is that it matters more than the actual taper. Meaning, interest rates are likely to move higher during the rhetoric phase, not during the implementation of a taper. A paradox worth considering.
Commenti
Posta un commento