Passa ai contenuti principali

From a Failed Breakout to a Failed Breakdown


The historic action of the precious metals sector over the past few weeks has continued.

The strong recovery in GDX, GDXJ, and Silver has potentially invalidated the technical breakdown that occurred during the crash. It appears to be a failed breakdown.

Furthermore, Gold was looking vulnerable on the weekly, and monthly chart yet was able to slingshot back to $1700/oz. It is currently up $88/oz or 5.6% this month, while the S&P 500 is down 14%.

The market provides and conveys information day to day and week by week. Still, monthly charts will smooth out the volatility, and that is especially important during periods of extreme volatility. 

We plot the monthly line charts for Silver, GDX, and GDXJ below.

There are two trading days left in March, but note how these charts look entirely different from just a week ago.

Silver has not broken down to a new low nor have the miners (GDX, GDXJ), which are merely correcting. 

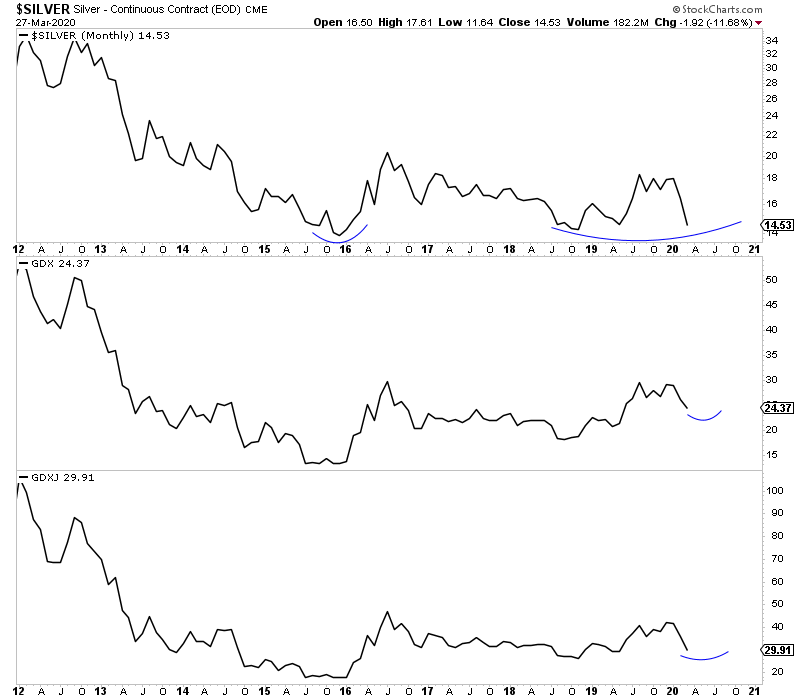
Silver, GDX, GDXJ Monthly Lines

If precious metals markets can maintain current levels into April, then that is a reason for optimism.

Another reason for optimism is that the recent rebounds in GDX and GDXJ are similar to the rebounds from the major low in late October 2008.

In closing price terms, GDX rebounded 39% in 8 days. That is slightly less than its 47% rebound in 6 trading days from the October 2008 low. 

However, when using absolute low and highs, GDX just rebounded 63% in 8 days. That exceeds its 57% rebound in 9 days from the October 2008 low. 

The parent index of GDXJ rebounded 51% in 8 days (in closing price terms) from its late October 2008 low. GDXJ just rallied 52% in 7 days!

After back to back sharp moves and high volatility, markets may consolidate as volatility subsides.

Should Gold, which closed last week at $1654, hold above $1540 to $1560, then it could be deemed a bullish consolidation.

GDX and GDXJ just rallied back to stiff resistance, and they could retreat more if Gold stays below $1700 for a little while.

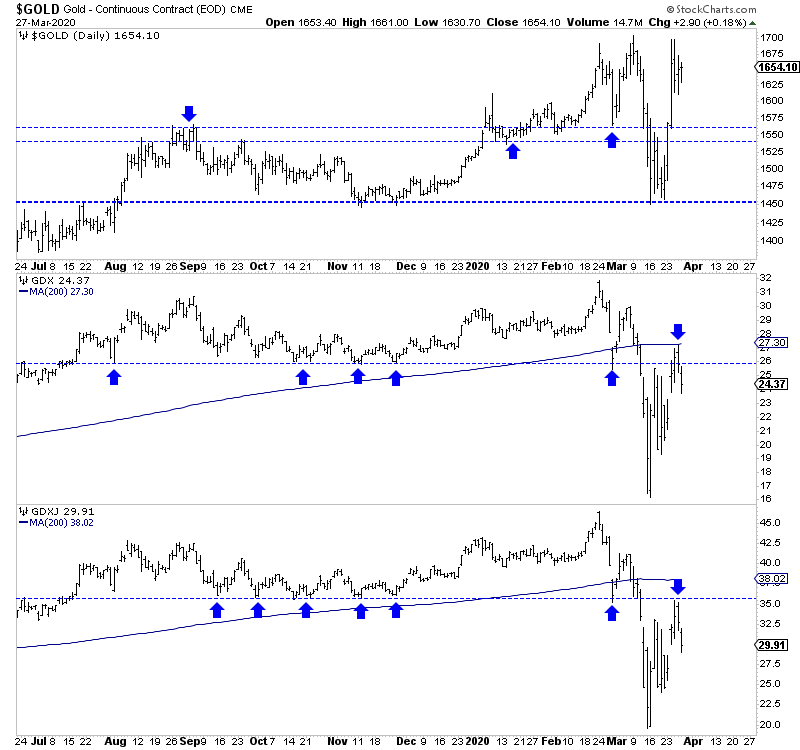
Gold, GDX, GDXJ Daily Bars

Note that precious metals markets followed the late October 2008 bottom with five to six weeks of backing and filling before pushing higher in an impulsive fashion.

Gold faces resistance at $1700, and its net speculative position remains above 300K contracts. GDX and GDXJ face stiff resistance around $26-$27 and $35-$36, respectively. It could take the market a few weeks or longer to work through that supply.

I am looking to put more cash to work if individual, quality juniors correct more and get somewhat close to recent lows.

The crash has delivered short-term pain and anxiety, but it is leading to some incredible values that could turn into 5 and 10 baggers over the next 12 to 18 months. To learn more about the stocks we own and intend to buy that have this potential, consider learning more about our premium service. 

Commenti

Post popolari in questo blog

Charting the World Economy: The U.S. Jobs Market Is On Fire - Bloomberg

Charting the World Economy: The U.S. Jobs Market Is On Fire - Bloomberg https://www.bloomberg.com/news/articles/2019-12-06/charting-the-world-economy-the-u-s-jobs-market-is-on-fire Charting the World Economy: The U.S. Jobs Market Is On Fire Zoe Schneeweiss Explore what's moving the global economy in the new season of the Stephanomics podcast. Subscribe via  Apple Podcast , Spotify or  Pocket Cast . The last U.S. payrolls report of the decade was a doozy, beating expectations and doing its bit to keep the consumer in good health heading into 2020. That's good news given the various pressures still weighing on global growth. Here's some of the charts that appeared on Bloomberg this week, offering a pictorial insight into the latest developments in the global economy. U.S. Advertisement Scroll to continue with content ...

Another Paradox: Consumer Spending Expectations Surge, Despite Dismal Income, Earnings

Call it the latest economic paradox. Despite widespread stories of doom and gloom about the state of US consumer finances once the fiscal stimulus bill expires on Dec 31, the latest NY Fed survey of consumer expectations unexpectedly shows that US consumers have little intention of slowing down their spending. In fact, and very paradoxically,  despite depressed and flat income and earnings growth expectations,  with median one-year ahead expected earnings growth at 2.0% for fifth consecutive month and expected income growth barely little changed at 2.14% ... ...  consumers' 1-year ahead  spending growth expectations  jumped to 3.73% over the next 12 months in November  - the highest level in more than four years, not only up from the 3.06% in the previous month but a whopping 33% more than the 2.8% reported last November,  making this the biggest Y/Y increase in expected spending in series history. This bizarre increase took place even as labor market signals were mixed: although t...

China Exports, Imports Fall Sequentially, Adding To Slowdown Fears

China's exports rose 19.3% y/y in July, missing the median consensus expectation of 20% (ranging from 15.4% to 30.7%), and declining sequentially -0.3% in July after rising +5.7% in June. Imports also rose less than expected, up 28.1% Y/Y in July, below the 33.3% median expectation, and fell 6.4% sequentially after surging +11.3% M/M in June. As a result this disproportional slowdown in imports vs exports, China's monthly trade surplus actually rose to $56.6bn in July, slightly better than the $53.3BN consensus, and up from $51.5BN in June due to the bigger miss in imports. ASEAN was China's biggest trading partner in July, followed by the Europe Union and the U.S., customs data showed. China's exports to the US grew 13.4% in July from a year ago, while imports from America rose 25.6%, leaving a trade surplus of $35.4 billion in the month. Some more details: By geography:  Export growth slowed across major export destinations, and exports to major DMs continued to be a ...