Passa ai contenuti principali

MEGA PROFITABLE STRATEGY FOR NEXT HEAVY US STOCKMARKET DOWNLEG BELIEVED IMMINENT...

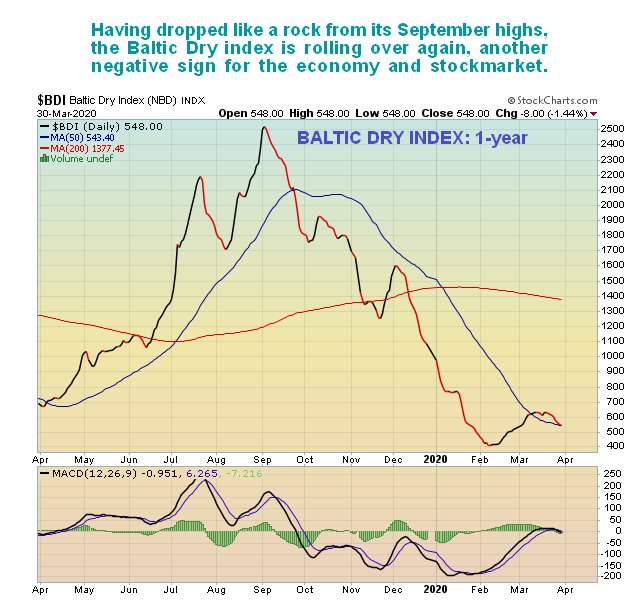
ONE OF THE BIGGEST SHORT COVERING RALLIES IN HISTORY MAY BE IMMINENT...
 
This morning we are going to look at an array of important factors pointing to another severe drop in the broad US stockmarket imminently, both factors external to it and indications on the charts for the S&P500 index (and other indices which we won't have time to look at).First it is well worth watching another classic video from Greg Mannarino posted yesterday: WOW.. ZERO Economic Activity in which he puts into words what many of us are thinking, and it's worth watching this at least a couple of times. Rather amusingly, "The Dark Side" tried to buy Greg off to shut him up, but he wasn't having it. This is how they operate – they buy you off, marginalize you, or take you out, whether you are an individual, a company or a country.Now we'll quickly look at related factors pointing another heavy drop by the stockmarket, and probably to new lows, before focusing on a way we can capitalize on this expected drop.We start with the Baltic Dry index, which was one of the factors we used to predict the crash before it started. On its 1-year chart we can see that it cratered from September through February, and after a feeble bounce in recent weeks is dropping again…

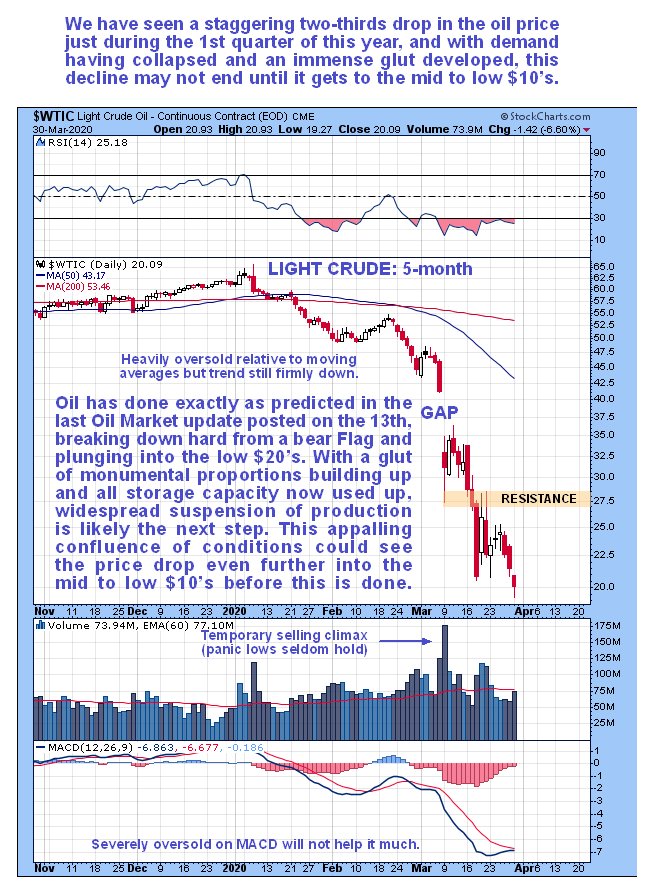
Next oil, which as you all know has cratered, with Light Crude, shown below, dropping by a stunning two-thirds just this year. In the last Oil Market update, posted on the 13th, we forecast that it would break down from a bear Flag and plunge into the low $20's, and that is exactly what has happened…

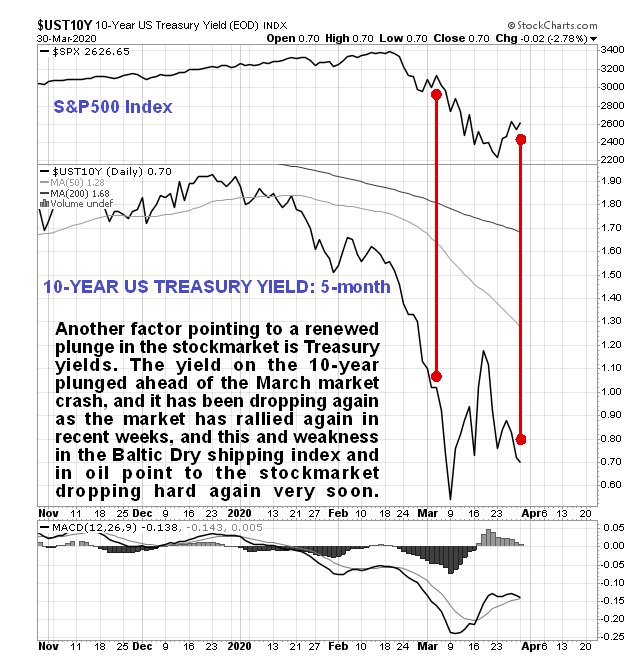
Lastly, Treasury yields are dropping again, pointing to (initially) deflation, that will be followed by rampant inflation, as Central Banks' profligacy comes out the other end of the pipe. Observe how the 10-year yield plunged ahead of the stockmarket collapse in March. Then they recovered some, which helped to give rise to the big stockmarket bounce, but now they are ominously dropping away again…

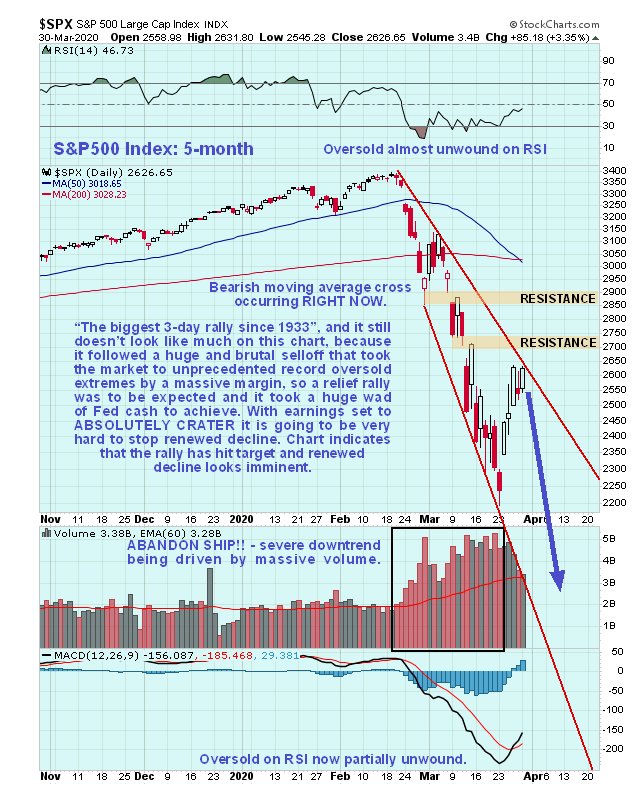
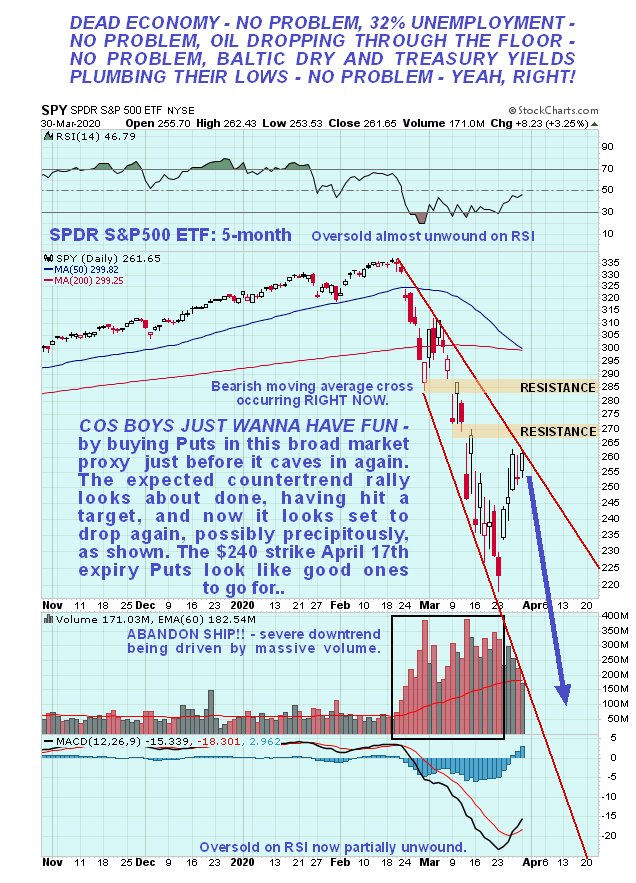
Turning to the stockmarket itself, we see on the latest 5-month chart for the S&P500 index that while the Fed's big intervention stoked a massive short covering rally, it DID NOT break it out of our expanding downtrend channel, which now looks set to turn it down into a really severe downleg, made much more likely by the factors that we have considered above.

A way to capitalize on this expected drop, for those who are up for it, is to use the vehicle that we used before, the SPDR S&P500 Index ETF, which has options with good liquidity and narrow spreads. Since SPY is a close proxy for the S&P500 index, its chart looks almost identical…

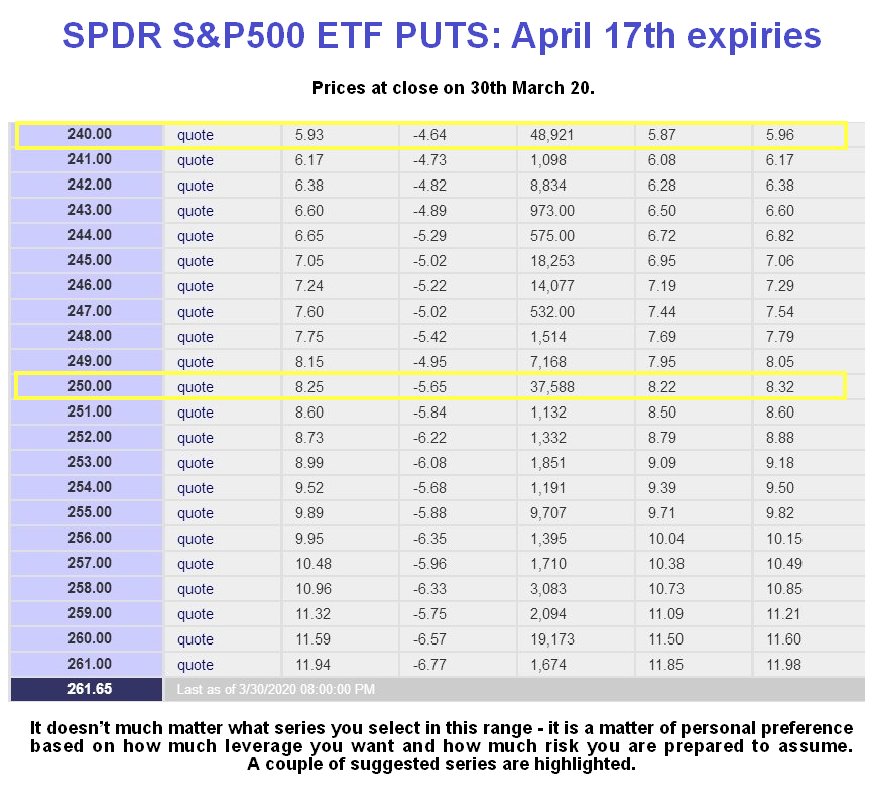
Below is a table showing suitable Put options in SPY. You can use any series to suit yourself, depending on how much leverage you want and how much risk you are prepared to assume. Note that there are more series available that are off the limits of this table. These options are only recommended for subscribers who have sufficient knowledge and experience to be comfortable trading them. They are obviously a high risk play, especially as, due to the current high volatility, premiums are high, but that said, if we get it right, we should still do very well with them.
Table courtesy of bigcharts.com  

Commenti

Post popolari in questo blog

Charting the World Economy: The U.S. Jobs Market Is On Fire - Bloomberg

Charting the World Economy: The U.S. Jobs Market Is On Fire - Bloomberg https://www.bloomberg.com/news/articles/2019-12-06/charting-the-world-economy-the-u-s-jobs-market-is-on-fire Charting the World Economy: The U.S. Jobs Market Is On Fire Zoe Schneeweiss Explore what's moving the global economy in the new season of the Stephanomics podcast. Subscribe via  Apple Podcast , Spotify or  Pocket Cast . The last U.S. payrolls report of the decade was a doozy, beating expectations and doing its bit to keep the consumer in good health heading into 2020. That's good news given the various pressures still weighing on global growth. Here's some of the charts that appeared on Bloomberg this week, offering a pictorial insight into the latest developments in the global economy. U.S. Advertisement Scroll to continue with content ...

Another Paradox: Consumer Spending Expectations Surge, Despite Dismal Income, Earnings

Call it the latest economic paradox. Despite widespread stories of doom and gloom about the state of US consumer finances once the fiscal stimulus bill expires on Dec 31, the latest NY Fed survey of consumer expectations unexpectedly shows that US consumers have little intention of slowing down their spending. In fact, and very paradoxically,  despite depressed and flat income and earnings growth expectations,  with median one-year ahead expected earnings growth at 2.0% for fifth consecutive month and expected income growth barely little changed at 2.14% ... ...  consumers' 1-year ahead  spending growth expectations  jumped to 3.73% over the next 12 months in November  - the highest level in more than four years, not only up from the 3.06% in the previous month but a whopping 33% more than the 2.8% reported last November,  making this the biggest Y/Y increase in expected spending in series history. This bizarre increase took place even as labor market signals were mixed: although t...

China Exports, Imports Fall Sequentially, Adding To Slowdown Fears

China's exports rose 19.3% y/y in July, missing the median consensus expectation of 20% (ranging from 15.4% to 30.7%), and declining sequentially -0.3% in July after rising +5.7% in June. Imports also rose less than expected, up 28.1% Y/Y in July, below the 33.3% median expectation, and fell 6.4% sequentially after surging +11.3% M/M in June. As a result this disproportional slowdown in imports vs exports, China's monthly trade surplus actually rose to $56.6bn in July, slightly better than the $53.3BN consensus, and up from $51.5BN in June due to the bigger miss in imports. ASEAN was China's biggest trading partner in July, followed by the Europe Union and the U.S., customs data showed. China's exports to the US grew 13.4% in July from a year ago, while imports from America rose 25.6%, leaving a trade surplus of $35.4 billion in the month. Some more details: By geography:  Export growth slowed across major export destinations, and exports to major DMs continued to be a ...