At its most extreme this morning, I'd estimate the mkt was pricing in almost 10% probability of a 25bp cut by the Fed tomorrow. How do I figure? It's based on FFQ9 (August Fed Funds futures).
FFQ9 is the 30-day August Federal Funds futures contract. It's priced as a simple average of Daily Effective Federal Funds Rate (hereafter "EFFR") for each day of the month. That rate is published in arrears (i.e. what's published today is yesterday's rate) on a daily basis at 9:00am EST by the New York Fed. It's currently 2.13% (3bps over IOER).
IMPORTANT NOTE: There's an extremely large number of realistic possible outcomes, including those where IOER continues to drift lower. There are reasons relating to the plumbing of the money markets that make this unlikely, but it's a possibility. I'm only addressing the one which is most pressing: the market-implied probability of an emergency Fed ease.
Here's a table showing how this daily calculation works with 3 different scenarios which I'll discuss in more detail below.
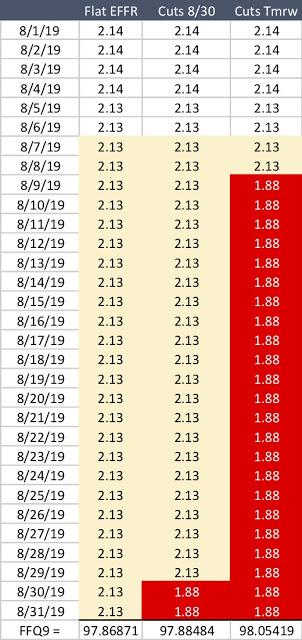
EFFR has been trading anywhere from flat vs IOER to 5bps over for the better part of the last 6 months. When the Fed cut rates on July 31, EFFR went down by 26bps - from 2.40% to 2.14%. It stayed at 2.14% for the first two business days of the month, then went to 2.13%.
Because EFFR stayed at 2.14% on Friday August 2nd, that means according to the calculation methodology that the first 4 days of the month (i.e. the non-business days of Sat & Sun) also get counted as 2.14%. Therefore, assuming the Fed doesn't do anything the rest of the month, the fair value of FFQ9 would be calculated as the simple average of 4 days at 2.14% and 27 days at 2.13%. Therefore price = 100 - rate = 97.86871.
But FFQ9 traded at 97.885 this morning! So what gives?
Clearly the mkt is pricing in some probability of EFFR being much lower that 2.13% at some point this month. But when? Emergency eases are just that: "emergencies". They're not telegraphed ahead of time or scheduled. So, we can only calculate probabilities by making an assumption about the day of the cut.
Let's take an example. Say the Fed cuts by 25bps on the last Thursday of the month (8/29), for whatever reason. EFFR only falls on the day AFTER a Fed cut (it wouldn't take effect the same day), so we'd have two days of 2.13% - 25bps = 1.88% (8/30 & 8/31). Under that scenario FFQ9 = 97.88484. Close to current market pricing. But that's assuming a 100% probability of a cut on 8/29. Markets don't work in 0% or 100% probabilities. It's frequently something in between. So then, what's the probability of the Fed cutting 25bps TOMORROW?
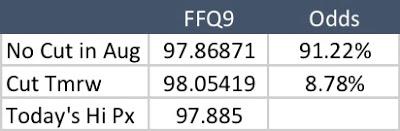
If the Fed cut 25bps tomorrow, that would mean we'd have 4 days of 2.14%, 4 days of 2.13% (both today - which we don't know yet - and tmrw would be 2.13% along with Monday & Tuesday's rates), and 23 days of 1.88%. That price works out to 98.05419. Given that, we can work out what the probability assigned to this outcome should be.
If "no cut" = 97.86871 and "25bp cut tmrw" = 98.05419, we can work out what a market price of 97.885 implies. That is:
97.885 = 98.05419 * X + 97.86871 * (1 - X), where X = probability of a cut tmrw.
By applying a little elementary algebra, X = 8.78% or ~9%.
Now, clearly, there's a lot at work here. The market has to price in all possible paths of cuts which could theoretically take place on any day (including a weekend, in theory, which would cause EFFR to take effect at the lower rate on the following Monday). As I'm writing this, FFQ9 has ticked back lower, suggesting that the market is assigning less probability to a forthcoming emergency ease. But it's clearly a fluid situation. SPX another -5% might alter the entire calculus.
Also, EFFR could drift lower relative to IOER. I would emphasize "could". We "could" also drift higher. The odds of those events are roughly offsetting, to be conservative. We spent the last month trading closer to 5bps over IOER (which, if applied to the scenario for the rest of this month, would imply an even higher mkt-implied probability for emergency Fed action).
Commenti
Posta un commento