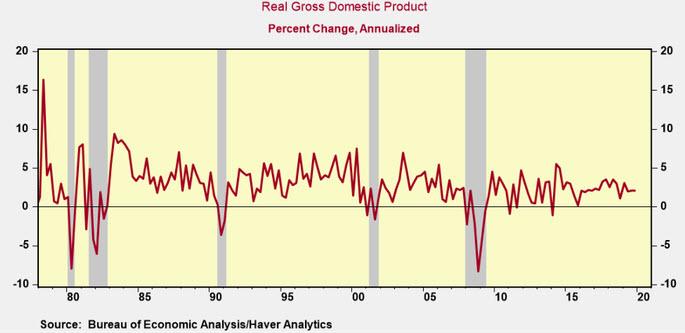
GDP's Largest Quarterly Declines
In the past 60 years, the US economy experienced two exceptionally large quarterly declines in real GDP. In Q4 2008 real GDP dropped an astounding 8.4% annualized and in Q2 1980 real GDP contracted 8.0%. The forces behind each decline, as well as the composition, were markedly different but both episodes can still provide some guidance on what to expect.

For example, in 1980, the sharp decline in real GDP was driven by the imposition of credit controls by the federal government, and the uncertainty surrounding the actions of the new policy. Consumers interpreted the Fed directive to "stop using credit cards" and a poll showed 58% of consumers used credit less than before, resulting in a record contraction of 8.7% annualized in real consumer spending in Q2 1980.
In Q4 2008, the sharp drop in economic activity occurred during the abrupt and sharp collapse in the financial markets, following the bankruptcy of Lehman Brothers. In Q4, the plunge in real GDP was driven by 20% to 30% annualized quarterly declines in business investment, housing and exports, as the financial crisis became a global crisis, much like the coronavirus. Real consumer spending took a hit as well, but fell only half as much as overall GDP.
The economy in 2020 faces a number of the same issues. To be sure, there is growing uncertainty (and in some cases panic) surrounding the coronavirus. And there is also confusion and fallout following the federal and state governments imposing widespread restrictions on all types of domestic and foreign travel, work-life, as well as social and business gatherings, events and conferences. The coronavirus is also a global crisis, impacting business activity in a number of major trading partners while also disrupting global supply chains. On top of all of that there is sharp drop in the equity markets that has wiped out over $7 trillion in household wealth in a span of a month or more, which will weigh heavily on consumer confidence.
Many of the consumer and business service sectors are likely to feel the brunt of the drop in sales and revenue. Unfortunately, there is no "real time" hard monthly numbers on sales and revenues for the service sector. The Census Bureau quarterly report on service sector revenue is released almost 80 days after the end of quarter, so a full assessment of service sector revenue and sales for Q1 will not be known until June and Q2 data will not be known until the end of September.
Conversation with a senior official at the Bureau of Economic Analysis indicated that government statisticians are discussing how to properly assess the "data" shortfall, and for now will be monitoring many of their "early" indicators, such as jobs. But its important to keep in mind that during downturns sales and revenues per employee fall hard, so the jobs data will not provide a full assessment of the drop off in service sector revenues.
Given the speed and breadth of events investors should brace for a decline in economic activity that's more than twice consensus estimates, with company sales and profits declines that prove to far larger than what equity analysts currently expect.
Commenti
Posta un commento