It's 'quad witch' today, Historically, quad-witch weeks have meant a collapse in vol and surge in stocks - no matter what the news.
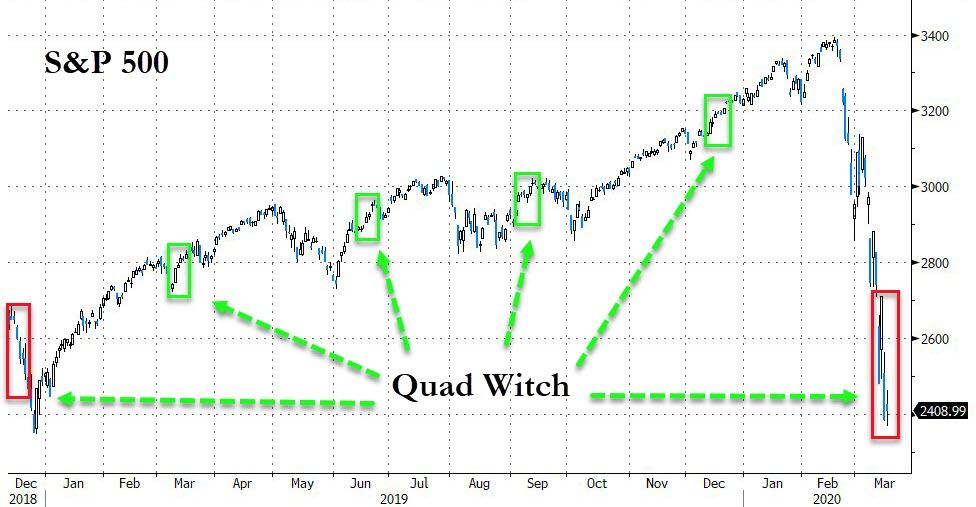
But, this week (and last) has been different, to say the least...
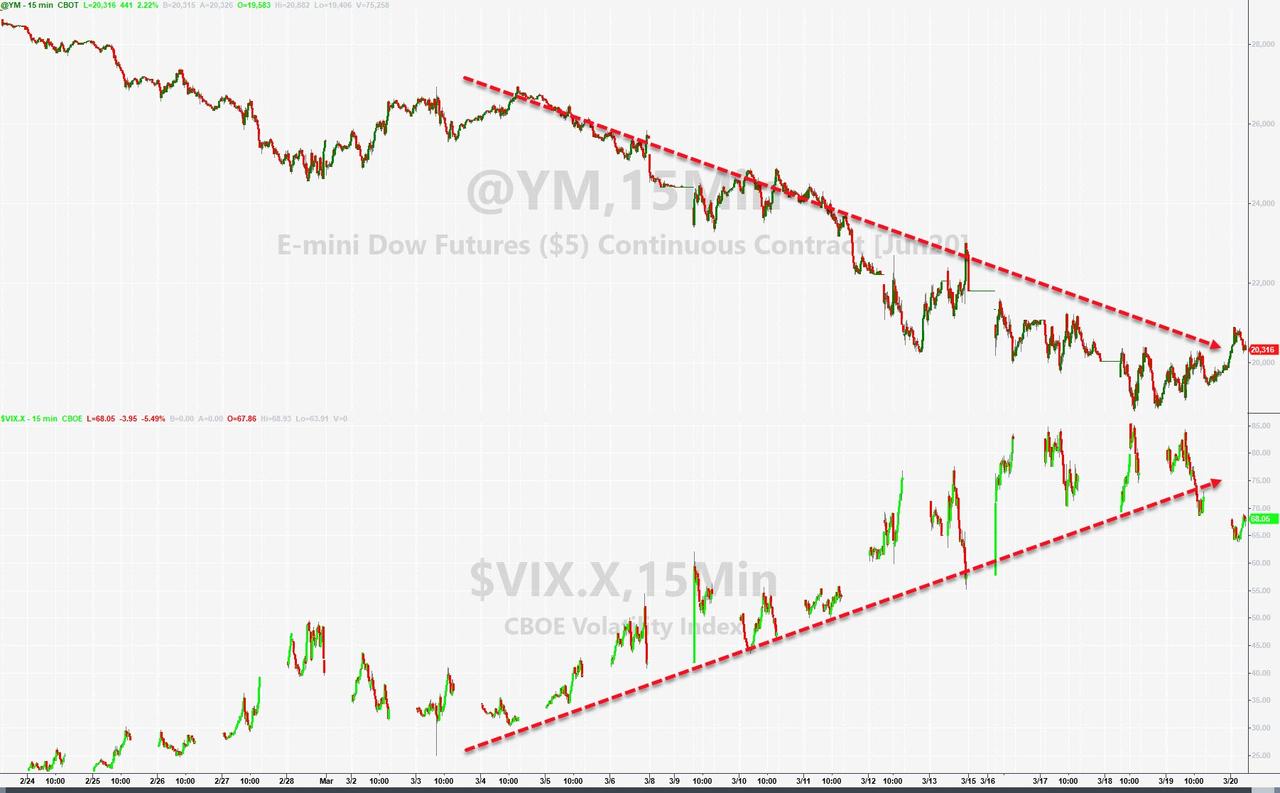
However, as Nomura's Charlie McElligott explains below, today's option expiration may stall that chaotic volatility... at least to some extent.

While volatility has been extreme across all asset-classes, in equity markets, McElligott notes we are approaching the "nitty gritty" of today's "Serial" Options Expiration, which is set to be the largest notional on record - and all with no CBOE floor operation.
The extreme Dealer "Short Gamma" phenomenon of the past 1.5 months is in the process of CLEARING, on account of the now-completed VIX expiry (Wed, now UX1) and today's Quad Witch Op-Ex, where our updated numbers show potential for upwards of 39% of the aggregate $Gamma in SPX / SPY options could "drop-off."
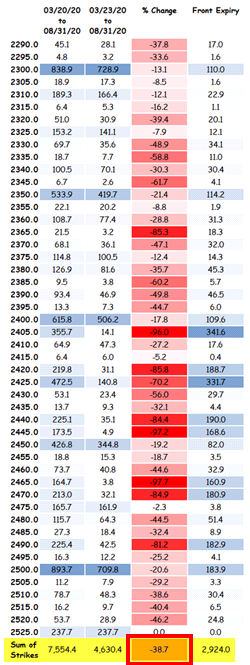
In English, this would eliminate a significant portion of the Dealer hedging flow which has contributed to the "negative convexity" -like violence of moves (particularly, forcibly selling into selloffs, but also too buying highs)
The ongoing theme that "there's nothing left to sell" from the Vol Control space:
...0.0%ile (10Y rank),
Equities allocation from Tgt Vol and 0.1%ile (since '11)
Equities allocation from Risk Parity strategies

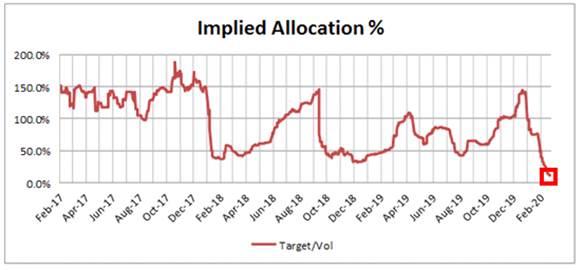
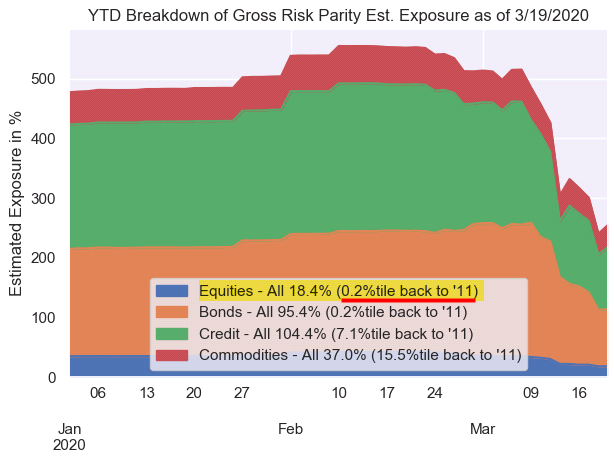
...all mean that generally-speaking, this mechanical source of "sell flow" for the past two months is largely removed from the picture at this juncture, and is an incremental BUYER going-forward on a potential Vol normalization - which is increasingly likely now that Dealer "Short Gamma" is finally clearing via Op-Ex in a "virtuous feedback loop."
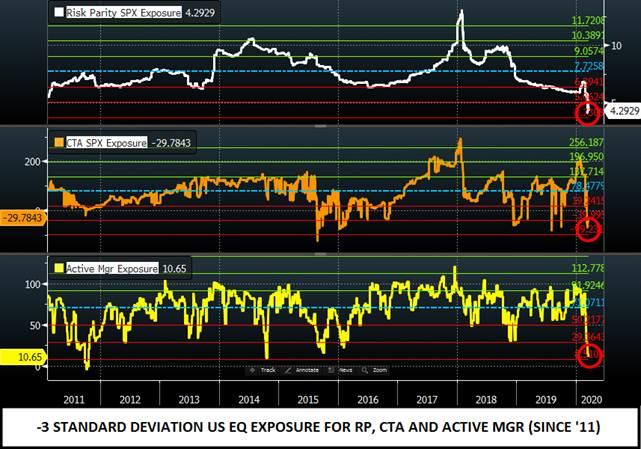
Similarly, McElligott's proxy for "Active Mgr Exposure" to US Equities earlier this week printed lows last made in 2011 and 2014, and a -3 z-score ranking since 2011 - putting it "in-line" with Risk Parity- and CTA Trend- S&P 500 Exposure, both themselves at -3 z-score S&P exposures over the same period - meaning more likely to be "adding" vs "reducing" here.
Taking this enormous "short cover" into context with the enormous outperformance of "Popular HF Longs" (HF VIPs +4.6%; 1Y Momentum Longs +3.4%; HF Overweights +2.8%; HF Top 50 +2.6%...all vs SPX +0.5% yday), it indicates a powerful "Netting-UP" of exposure from the leveraged community yesterday in anticipation of a bounce.
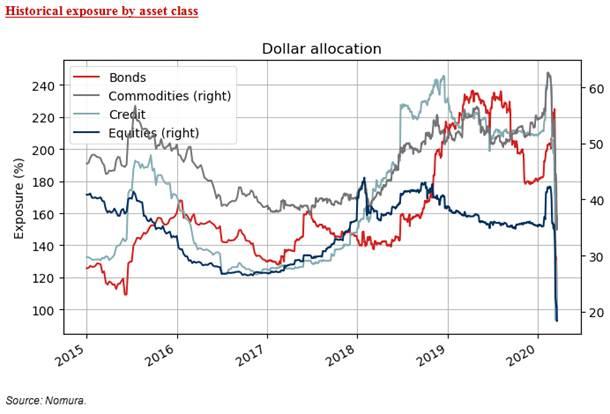
Additionally, the Nomura MD notes that Month- and Quarter- end will merit an enormous Pension Rebalance flow (buy Eq, sell Bonds), simply on account of the impossible performance spread btwn Bonds (AGG -3.0% QTD) and Stocks (S&P -25.4% QTD) on the period.
Estimates are for upwards of $120B to $200B of Stock index to "buy," typically occurring over the final week of the period; as previously stated, "pension rebalances" only tend to matter (with regards to backtests which "confirm" the flows) when the performance spread is "extreme," and the current Bond outperf vs Stocks QTD is 0.7%ile outcome since 1982!
And while on the topic of bonds, Nomura has an alert:
"Tokyo was on holiday, futures volumes were very light, with TY trading a mere 217k contracts. Liquidity is not bad, it is NON-EXISTENT and trying to sell $75bn of USTs to the Fed today is going to be problematic to say the least (how are you supposed to get duration back in futures? Also what if futures hit circuit breakers to the upside during a buyback and you can't buy them?)...
This has all the markings of a disastrous session."
Stay safe.
Commenti
Posta un commento