Passa ai contenuti principali

Market Bottom Indicators #1 – VIX Futures Term Structure

Summary: The current VIX level indicates significantly negative returns ahead for S&P 500 and four times the normal volatility on a daily basis. In addition the VIX futures term structure suggests that traders are rewarded for being long and that VIX is expected to be very high even in May. Speculative positions in VIX options and futures suggest that short volatility positions have been cut aggressively but that 15% of open interest is still short.

* * *

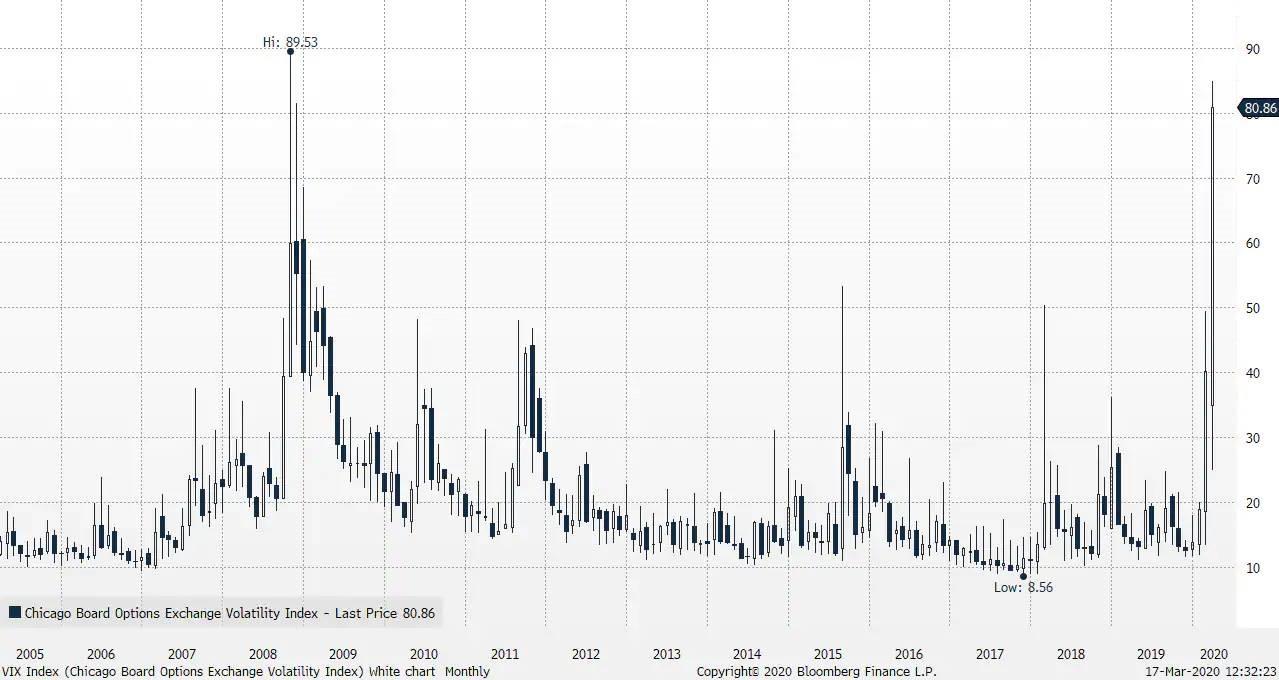
Equity option markets provide investors with valuable information about expectations for volatility and the time value embedded. The VIX Index closed at 82.69 which was a new record close surpassing closing VIX prices during the Great Financial Crisis in 2008. However, the absolute intraday peak of 89.53 in 2008 has not been surpassed yet. Historical analysis of the VIX Index suggest that VIX at these levels puts the market into a state with significant negative return expectations and realized volatility more than four times the normal level combined with extreme large kurtosis. In other words, equities are biased towards more declines from current levels.
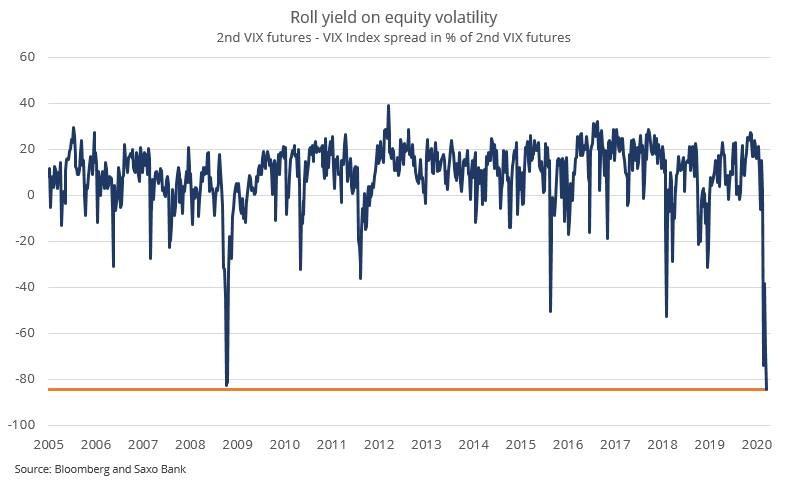
However, hidden in the VIX futures term structure clues for when the equity market bottoms are visible. The term structure of VIX (how the price of future contracts relates to the spot) is normally in contango (upward sloping) meaning that VIX futures have a higher price than the spot. This means that the futures market is pricing on average than volatility will rise from current levels. Historically this premium to spot has been too high relative to the subsequent realized volatility and thus traders have made money by shorting the different VIX futures contracts which then rolls down creating a positive roll yield for being short volatility.

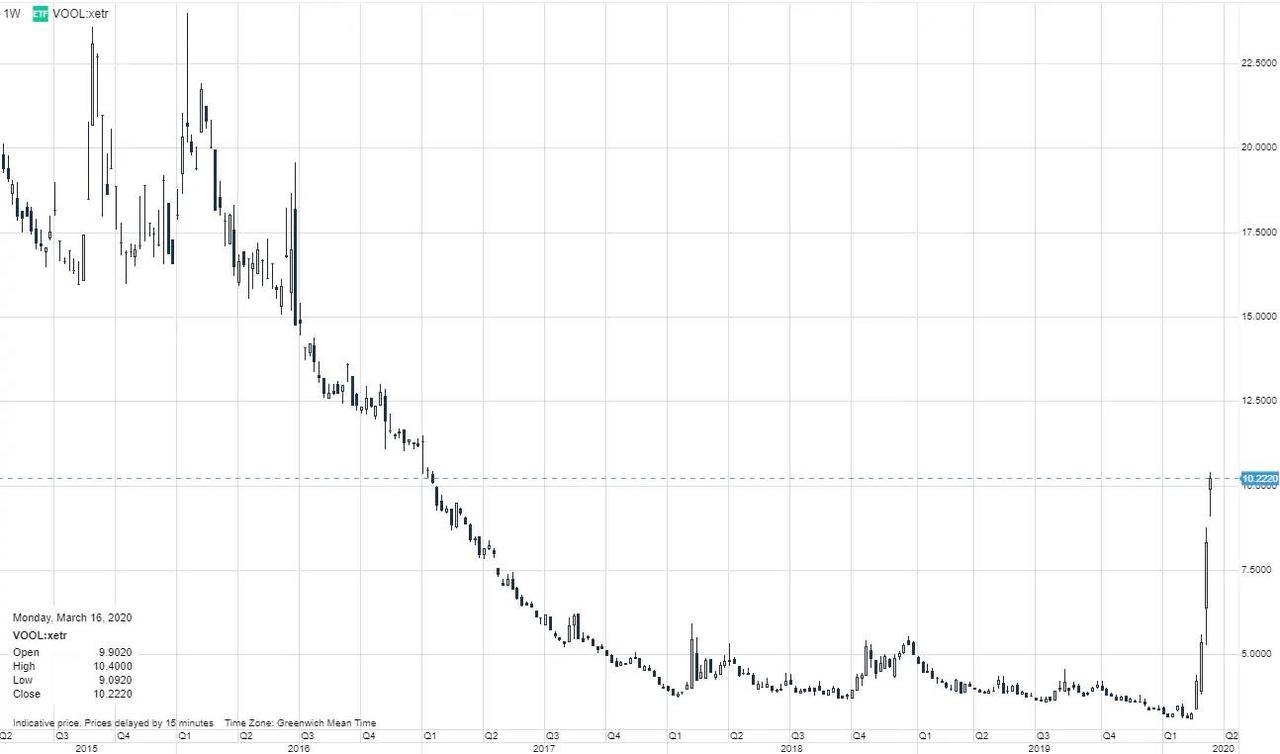
The current spread in percentage between the second futures contract (expires in May) and spot is -84.5% which is lower than during the Great Financial Crisis in 2008. This means that the expecting VIX to fall over the coming months but only to levels around 44 which would still be very high levels. The steep backwardation (downward sloping) creates a tailwind for being long volatility. The Lyxor ETF S&P 500 VIX Futures Enhanced Roll (vool:xetr) is one way to express this. When the VIX futures term structure (2nd VIX contract / VIX Index) has been higher than -10% we typically see positive equity markets. For clients that want to track this spread the VIX Index and the current 2nd month VIX futures contract have the Saxo ticker codes VIX.I and VXK0 respectively.

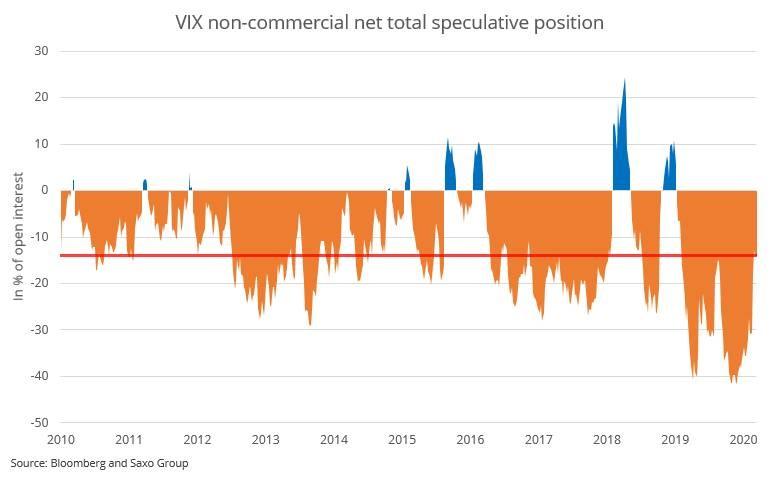
Another way to gauge when the market has exhausted itself is be looking at the speculative positions in VIX options and futures. We have come from the largest short volatility position ever with 40% of open interest being short, that's yield chasers dominating volatility hedgers. The data is one week delayed but still shows that the short volatility positions have been cut massively but not to zero yet. If speculative positions move into positive then it would be another sign of equity market bottoming.
Commenti

Post popolari in questo blog

Fwd: The Looming Bank Collapse The U.S. financial system could be on the cusp of calamity. This time, we might not be able to save it.

After months  of living with the coronavirus pandemic, American citizens are well aware of the toll it has taken on the economy: broken supply chains, record unemployment, failing small businesses. All of these factors are serious and could mire the United States in a deep, prolonged recession. But there's another threat to the economy, too. It lurks on the balance sheets of the big banks, and it could be cataclysmic. Imagine if, in addition to all the uncertainty surrounding the pandemic, you woke up one morning to find that the financial sector had collapsed. You may think that such a crisis is unlikely, with memories of the 2008 crash still so fresh. But banks learned few lessons from that calamity, and new laws intended to keep them from taking on too much risk have failed to do so. As a result, we could be on the precipice of another crash, one different from 2008 less in kind than in degree. This one could be worse. John Lawrence: Inside the 2008 financial crash The financial...

Charting the World Economy: The U.S. Jobs Market Is On Fire - Bloomberg

Charting the World Economy: The U.S. Jobs Market Is On Fire - Bloomberg https://www.bloomberg.com/news/articles/2019-12-06/charting-the-world-economy-the-u-s-jobs-market-is-on-fire Charting the World Economy: The U.S. Jobs Market Is On Fire Zoe Schneeweiss Explore what's moving the global economy in the new season of the Stephanomics podcast. Subscribe via  Apple Podcast , Spotify or  Pocket Cast . The last U.S. payrolls report of the decade was a doozy, beating expectations and doing its bit to keep the consumer in good health heading into 2020. That's good news given the various pressures still weighing on global growth. Here's some of the charts that appeared on Bloomberg this week, offering a pictorial insight into the latest developments in the global economy. U.S. Advertisement Scroll to continue with content ...

The repo market is ‘broken’ and Fed injections are not a lasting solution, market pros warn

By Joy Wiltermuth Published: Dec 7, 2019 9:35 a.m. ET Banks prefer to keep money at Fed instead of lending to other banks Getty Images Examining $100 bills. Getty Images By Joy Wiltermuth Markets reporter The Federal Reserve's ongoing efforts to shore up the short-term "repo" lending markets have begun to rattle some market experts. The New York Federal Reserve has spent hundreds of billions of dollars to keep credit flowing through short term money markets since mid-September when a shortage of liquidity caused a spike in overnight borrowing rates. But as the Fed's interventions have entered a third month, concerns about the market's dependence on its daily doses of liquidity have grown. "The big picture answer is that the repo market is broken," said James Bianco, founder of Bianco R...