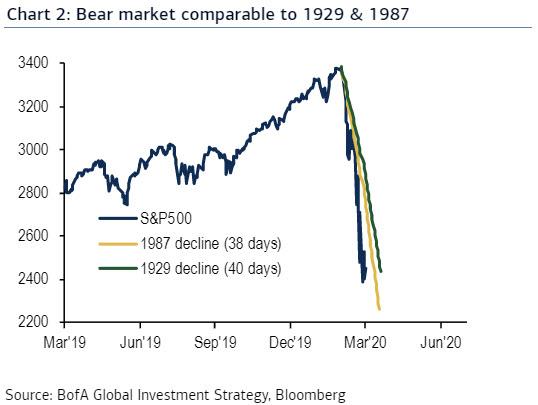
Back in December, someone in China made bat soup (at least according to the officially accepted narrative that doesn't get you banned on Facebook, Twitter, etc), and the rest is history: in the next three months, the global equity market has lost $24 trillion in value, more than the $22 trillion in US GDP. And here is a staggering chart from BofA putting the crash of 2020 in its historic context: in the past month, the US stock market has crashed faster than both the Great Depression and Black Monday, and in terms of the total drawdown, the crash of 2020 is now worse than 1929 and is fast approaching 1987.
Below, courtesy of BofA CIO Michael Hartnett, are several other stunning observations on the Crash of 2020:
- Calls for Fed corporate bond buying, New Deal fiscal policies, new Plaza Accord to stabilize US$, closure of stock exchange coincide with week of Wall St devastation.
- Peak-to-trough crash in global equity market cap = $24tn (c/o US GDP = $22tn).
- Monday's 12.0% drop Dow Jones = 3rd largest crash all-time (c/o -20.5% Oct 19th 1987, -12.9% Oct 28th 1929 - Chart 2).
- Liquidation of "safe havens" e.g. gold & US Treasuries (TLT ETF sank 20% after oil shock); epic US$ surge reflects funding pressure of excess US$-denominated debt & zero liquidity.
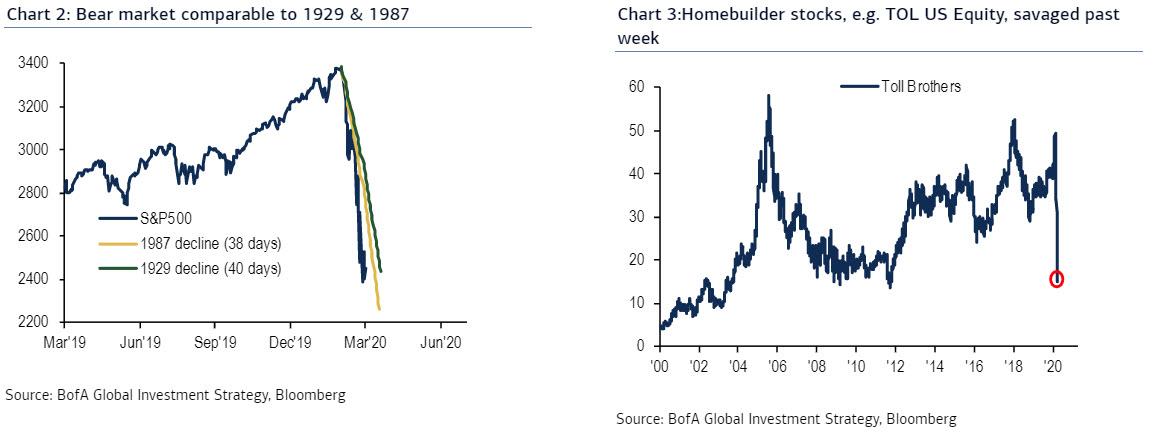
- Leverage in bond & stocks savaged (see REM, PFF, EMB, homebuilders like TOL - Chart 3); bond yields rise + bank stocks fall = classic sign of deflationary bear market.
- Feral Wall St means vicious bear market rallies...WTI oil surged 24% today.
- Stock exchange has closed just 4 occasions: 1914 & WW1, 1933 bank holiday, 1963 Kennedy assassination, 2001 9/11.
- Global "lockdown" on movement people, goods, services unprecedented but note June 1930 passage of protectionist Smoot-Hawley bill saw US stocks -16.5% in one month.
Policy panic: 42 rate cuts since Feb 1st (note was 36 cuts in 2 months following Lehman); average COVID-19 rate cut has been 70bps; massive global central bank liquidity promised with no upper bound; $2.4tn in global fiscal stimulus (2.7% of GDP) in public aid, loan & income commitments (rises to $3.7tn with US Treasury/Senate proposals = 4.2% global GDP); acceleration toward yield curve control, UBI, MMT, industrial intervention...utterly unprecedented stimulus & intervention that will ultimately cause higher inflation expectations.
- Macro: BofA economists & strategists slash GDP & EPS forecasts (Chart 11).
- Note US GDP = $22tn, consumption $15tn so 20% drop in income & spending in 2-month period means GDP -$750bn, US consumption -$500bn.
- Big pressure on corporate sector not to raise prices, cut employment…EPS takes Q2/Q3 strain.
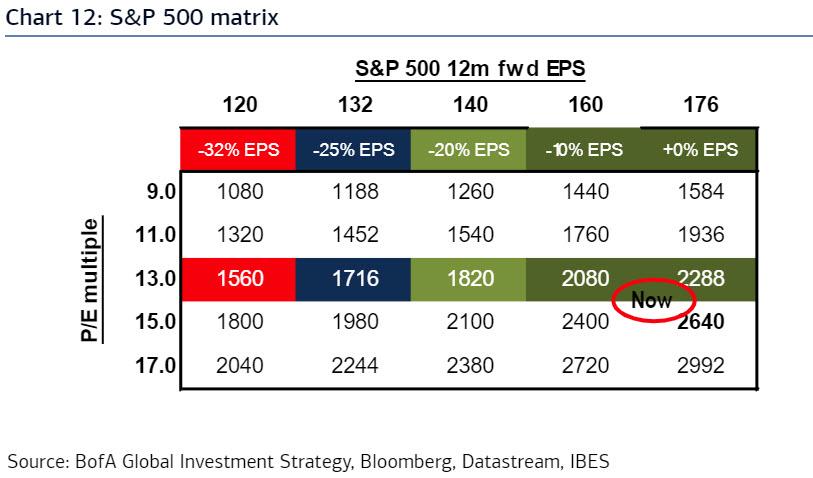
- 2020 SPX EPS of $140 (-20%) generates SPX 2100 on historic mean 15X multiple, SPX 1700 on 12X policy-failure multiple, 2400 on 17X "some policy success" multiple (see Chart 12).
- The "big stuff" will signal virus/recession/default fully-priced...volatility, Treasury yield, credit spreads, oil key.
- The Reckoning: big shocks, big tops, many big political & social changes ahead...localization of supply, relationship with China, new inflationary era, using technology to "live" without human interaction, geopolitical instability of Middle East/Africa, end of era of PE, buybacks, financial engineering, comeback of active vs passive investing.
- Q2 Strategy: aftershocks likely but assets with growth (tech), quality (best of breed stocks), yield (credits with fortress balance sheets) favored.
- Q2 Tactics: policy makers winning "Intervention vs. Deleveraging" war; small cap, cyclicals, oil, banks...bear market rally plays.
Good luck to everyone.
Commenti
Posta un commento