We're in the midst of the most volatile market environment in our lifetimes. Even more so than 2008. The daily noise is incredible, with headlines nonstop and wild price movements every hour and deep into the night as futures markets cover a wide terrain of price action amongst liquidations.

A dangerous market for any participant.
failure: How does the world prepare for pandemics?
Amid the noise it is important to step back and look at the big picture and I'll do this here because I think it's important for everyone interested to understand.
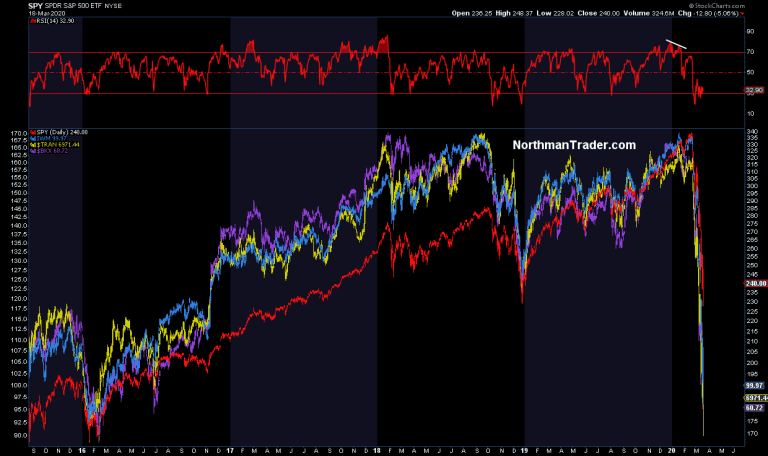
The bull market has been officially declared dead now that $DJIA has dropped over 10,000 points in a matter of 5 weeks $SPX down nearly 30% off its highs and other indices such $IWM, $BKX and $NYSE actually reverting all the way back to their 2016 lows. 4 years of buying taken out in 5 weeks.
It really is stunning, the most epic crash in our time:

But I will make perhaps a controversial statement. The structural bull market did not end in 2020. No Sir, it ended in the fall of 2018 and I can prove it.
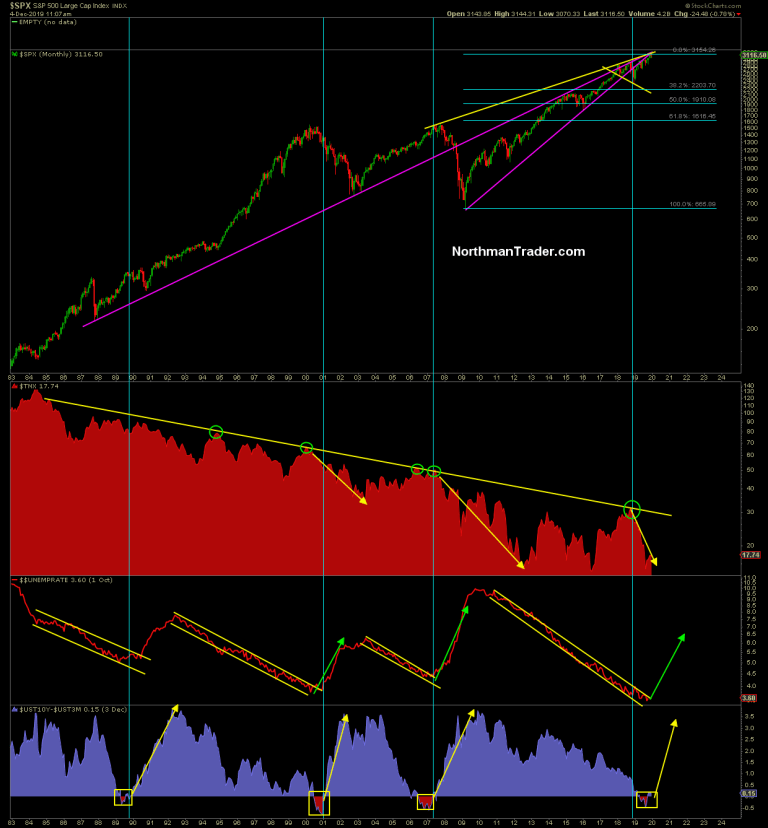
See there is this structural chart I've been tracking and posting for the better part of a year, most recently I posted it in December 2019:Sven Henrich✔@NorthmanTrader
Checking in on a big macro chart.$SPX
10 year
unemployment
yield curve
As far as the historical script is concerned it still all fits which suggests rising unemployment is coming, but also remains the missing link at this stage.

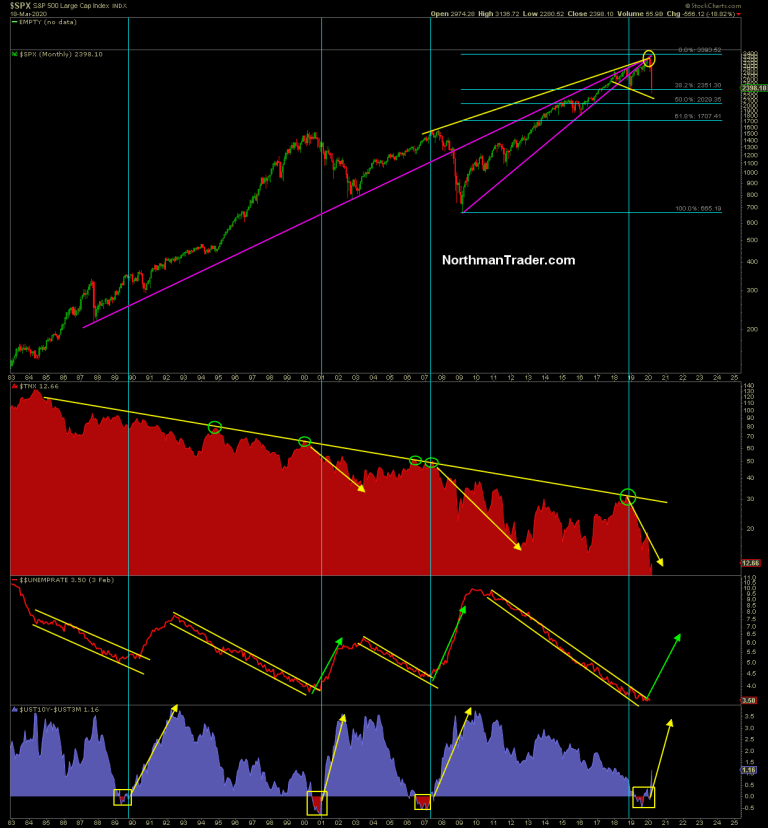
Here's the original chart for easier viewing:

From my perch the structural bull market ended when $TNX hit is long term trend line in October of 2018. It was also the time that the yield curve started inverting.
$SPX soon followed the historic message and broke its 2009 up trend in December 2018. For all intents and purposes it was over then. Just like it was over in all the previous occasions, especially 2000 and 2007.
The missing link though: Unemployment didn't budge, it stayed historically low.
But the Fed reacted nevertheless and flipped policy and started cutting rates and expanded its balance sheet and added repo to the mix. This lead not only to a massive multiple expansion rally in 2019, but it also produced the greatest bull trap of all time. Why? Because the structural bull market was already over, but people refused to see it. Too great was the attraction of easy money.
In process buyers pushed $SPX higher and higher into confluence of 3 major trend lines. 2007, 2009 and 1987. Notable: $SPX never, ever recaptured its broken trend line that broke in December of 2018, it just kept kissing it from the underside, never confirming the resumption of the bull trend.
The yield curve history suggested the yield curve would steepen, yields would keep dropping and markets would sell off and unemployment would rise.
And here we are:

All of these things have come to fruition. And unemployment will now jump dramatically as coronavirus has served as the trigger.
And be sure, the coronavirus will continue to be blamed.
But you know better. The structural bull market ended in 2018. The macro picture already told us. It was already set in motion. But central banks brought about a final hurrah in equity prices and trapped everybody long.
And what is this macro picture telling us now? That it's not over, we're just at the beginning of a long journey.
Yes rallies will come and I made the case for one yesterday (Month End Rally), but these cycle turns can last a year, two or even three. But we can't know.
For one the macro economy is more vulnerable than ever. Why? Because:Sven Henrich✔@NorthmanTrader
I think all the excess and reckless monetary policies of the past 11 years are directly responsible for the severity of this crash.
It caused all this TINA nonsense, made people chase, distorted asset prices and left the world unprepared.
And now they left themselves ineffective.5868:13 PM - Mar 18, 2020Twitter Ads info and privacy135 people are talking about this
Central banks are throwing the kitchen sink at this as we speak and so far to no avail. Hope is now that big fiscal stimulus packages will end up doing the trick.
And perhaps they will and produce a short term big reflation event especially if the coronavirus situation can be brought under control.
But then what are we left with? The greatest debt expansion ever will be saddled with even more debt:Sven Henrich✔@NorthmanTrader
The world ended 2019 with $253 trillion in debt.
And now they're forced to go pedal to the metal adding more debt than ever before with no end in sight.
And that will fix it all  https://www.cnbc.com/2020/01/14/global-debt-hits-all-time-high-of-nearly-253-dollars--iif-says.html …Global debt hits new record of $253 trillion and is set to grow even more this yearThe world's debt when compared against its total output hit another all-time high of over 322% in the third quarter of 2019, the IIF said in a new research report.cnbc.com3848:53 AM - Mar 19, 2020Twitter Ads info and privacy169 people are talking about this
Already on schedule for a $1 trillion deficit in 2020 before the crisis the US could easily get hit with $2-$3 trillion deficits in the next couple of years. In recent months both Jay Powell and Janet Yellen had been warning about the unsustainable expansion of US debt. That was before this crisis.
Yes they all need to intervene again now and more debt will be added but how will any of this makes the global economy stronger in the long term? None of the leaders of the world, be it fiscal or monetary have addressed any structural solutions in the past 20 years.
The sins of these past failures are now paid in spades with the worst market crash in our lifetimes. And the solution here is now to do the same all over again. I understand why we are doing it, and I hope they succeed while this crisis is ongoing as so many people are hurting. but we can't keep doing the same thing over and over and expect different results. This is the definition of insanity. And so the structural charts demand penance. And this penance will be paid for dearly in the long run.
So enjoy any recovery rally when it comes, but beware it likely will not last. That's what the big picture is telling you.
Commenti
Posta un commento