Passa ai contenuti principali

Here Comes The Depression: Empire State Manufacturing Crashes Most Ever To -78, Lowest In History

This is what a depression looks like.

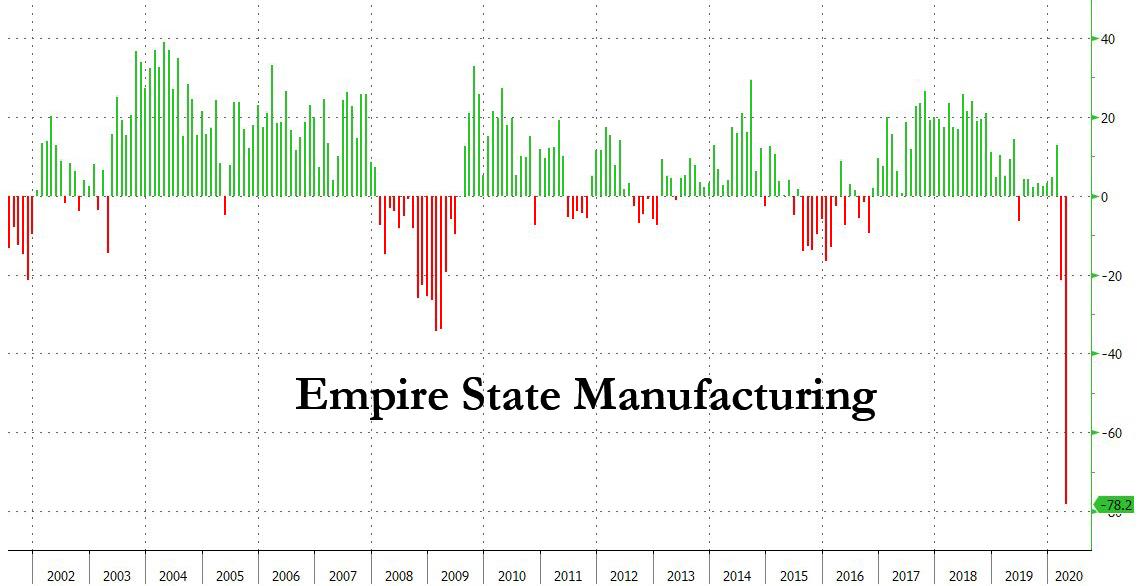
With Wall Street already expecting a catastrophic Empire Fed manufacturing index print of -35, just shy of the lows hit during the financial crisis, moments ago the NY Fed reported that New York State business conditions index plummeted fifty-seven points to -78.2, its lowest level in the history of the survey—by a wide margin. The chart says it all: the biggest miss ever, the biggest drop ever, the lowest print ever.

The details below the surface were dire: new orders and shipments declined at a record pace. Delivery times lengthened, and inventories fell. Employment levels and the average workweek both contracted at a record pace. Input price increases slowed considerably, while selling prices declined modestly. As usual, hope dies last and though current conditions were the worst in history, firms expected conditions to be slightly better six months from now.

Some more details: Manufacturing firms in New York State reported that business activity declined dramatically in early April. The general business conditions index fell fifty-seven points to -78.2, its largest point drop to its lowest level on record. By way of comparison, the lowest level this indicator had reached prior to April was -34.3 during the Great Recession.

Seven percent reported that conditions improved over the month, while 85 percent reported that conditions had worsened. The new orders index fell fifty-seven points to -66.3, and the shipments index dropped sixty-six points to -68.1, indicating a  sharp decline in both orders and shipments. Delivery times were longer and inventories were modestly lower.

There's more: labor market indicators were extremely weak. The index for number of employees fell fifty-four points to -55.3, with nearly 60 percent of respondents indicating lower employment levels. The average workweek index fell to -61.6, with 65 percent reporting shorter workweeks. The prices paid index fell nineteen points to 5.8, indicating a slowing in input price increases, while the prices received index fell to -8.4, pointing to a decline in selling prices for the first time since 2016.

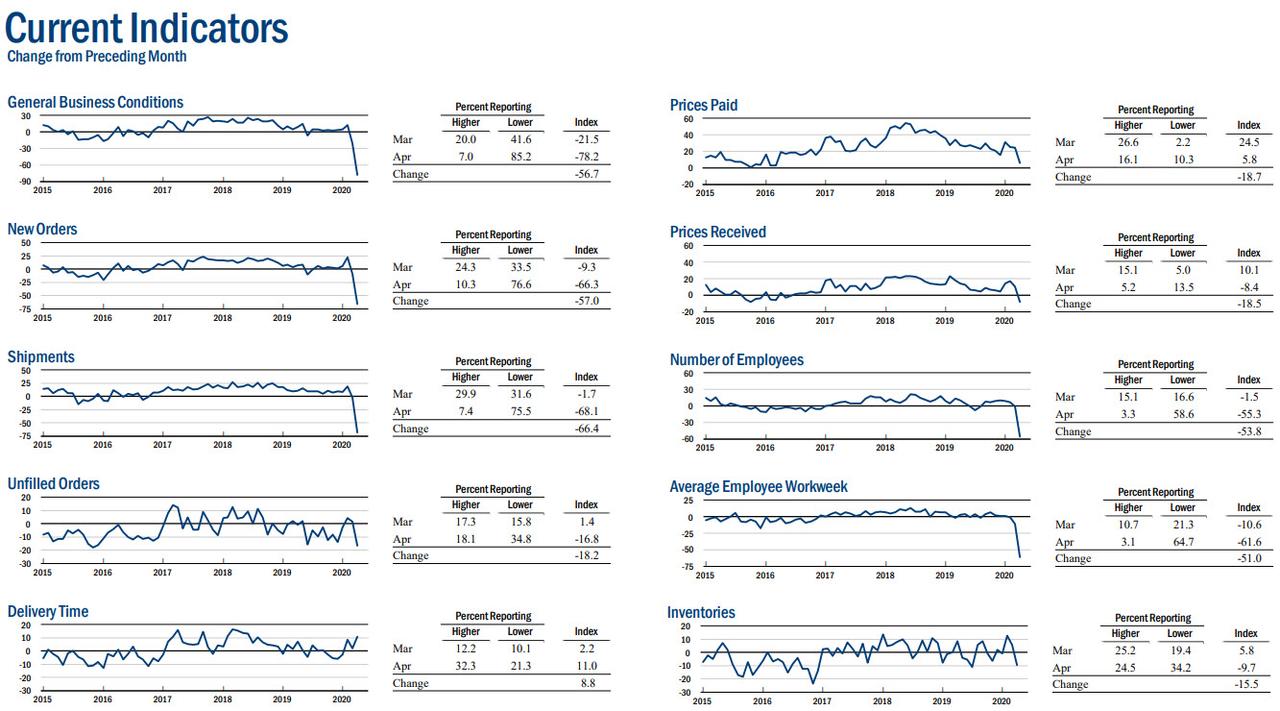
Looking ahead, firms anticipate a small improvement in business conditions over the next six months. The index for future business conditions edged up six points to 7.0. The indexes for future new orders and future shipments declined, but remained positive, suggesting that firms expect orders and shipments to be modestly higher in six months compared with this month's levels. The capital expenditures and technology spending indexes both fell to -11.0, a sign that firms planned to reduce both kinds of spending.

Finally, looking at other regional Fed indexes...

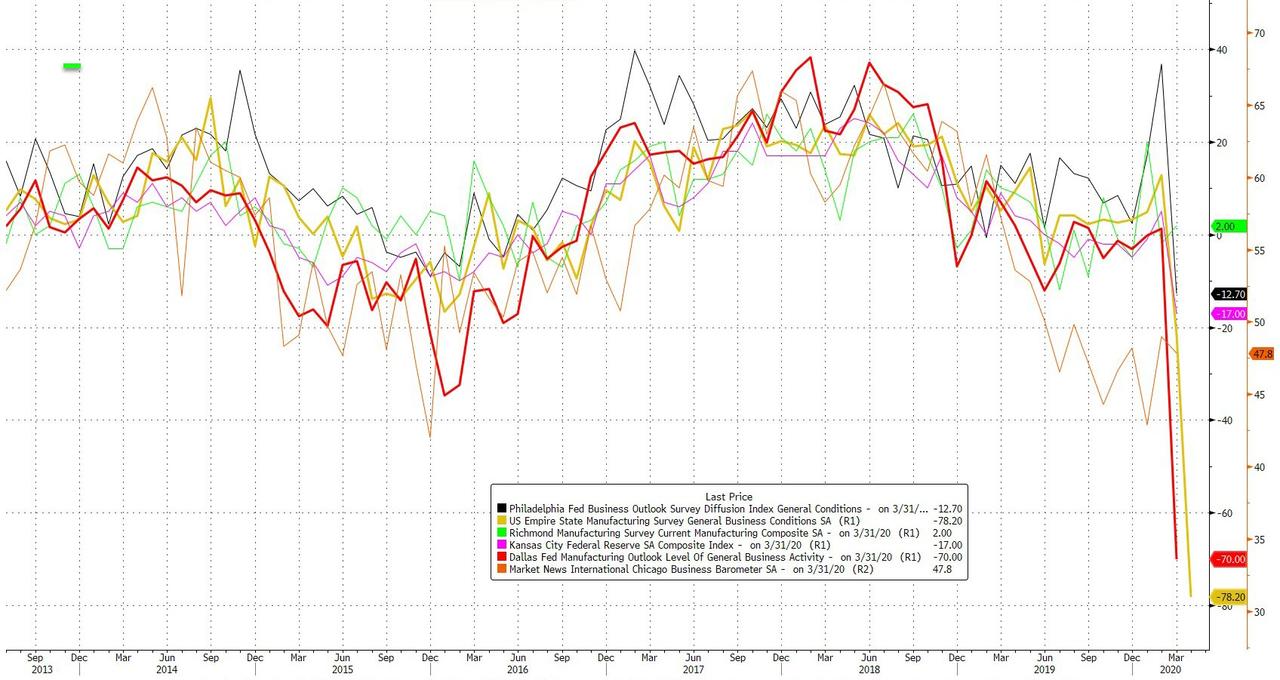
... the pain is only just starting.

Commenti

Post popolari in questo blog

Charting the World Economy: The U.S. Jobs Market Is On Fire - Bloomberg

Charting the World Economy: The U.S. Jobs Market Is On Fire - Bloomberg https://www.bloomberg.com/news/articles/2019-12-06/charting-the-world-economy-the-u-s-jobs-market-is-on-fire Charting the World Economy: The U.S. Jobs Market Is On Fire Zoe Schneeweiss Explore what's moving the global economy in the new season of the Stephanomics podcast. Subscribe via  Apple Podcast , Spotify or  Pocket Cast . The last U.S. payrolls report of the decade was a doozy, beating expectations and doing its bit to keep the consumer in good health heading into 2020. That's good news given the various pressures still weighing on global growth. Here's some of the charts that appeared on Bloomberg this week, offering a pictorial insight into the latest developments in the global economy. U.S. Advertisement Scroll to continue with content ...

Another Paradox: Consumer Spending Expectations Surge, Despite Dismal Income, Earnings

Call it the latest economic paradox. Despite widespread stories of doom and gloom about the state of US consumer finances once the fiscal stimulus bill expires on Dec 31, the latest NY Fed survey of consumer expectations unexpectedly shows that US consumers have little intention of slowing down their spending. In fact, and very paradoxically,  despite depressed and flat income and earnings growth expectations,  with median one-year ahead expected earnings growth at 2.0% for fifth consecutive month and expected income growth barely little changed at 2.14% ... ...  consumers' 1-year ahead  spending growth expectations  jumped to 3.73% over the next 12 months in November  - the highest level in more than four years, not only up from the 3.06% in the previous month but a whopping 33% more than the 2.8% reported last November,  making this the biggest Y/Y increase in expected spending in series history. This bizarre increase took place even as labor market signals were mixed: although t...

China Exports, Imports Fall Sequentially, Adding To Slowdown Fears

China's exports rose 19.3% y/y in July, missing the median consensus expectation of 20% (ranging from 15.4% to 30.7%), and declining sequentially -0.3% in July after rising +5.7% in June. Imports also rose less than expected, up 28.1% Y/Y in July, below the 33.3% median expectation, and fell 6.4% sequentially after surging +11.3% M/M in June. As a result this disproportional slowdown in imports vs exports, China's monthly trade surplus actually rose to $56.6bn in July, slightly better than the $53.3BN consensus, and up from $51.5BN in June due to the bigger miss in imports. ASEAN was China's biggest trading partner in July, followed by the Europe Union and the U.S., customs data showed. China's exports to the US grew 13.4% in July from a year ago, while imports from America rose 25.6%, leaving a trade surplus of $35.4 billion in the month. Some more details: By geography:  Export growth slowed across major export destinations, and exports to major DMs continued to be a ...