This Curve Will Never Flatten Again: Fed Balance Sheet Hits $6.1 Trillion, Up $2 Trillion In 1 Month

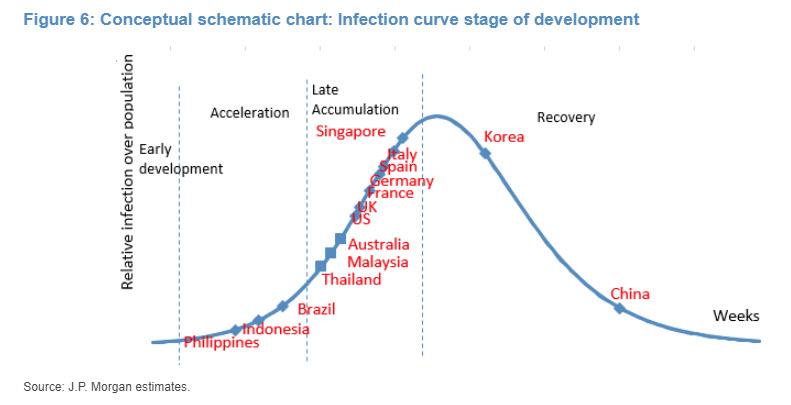
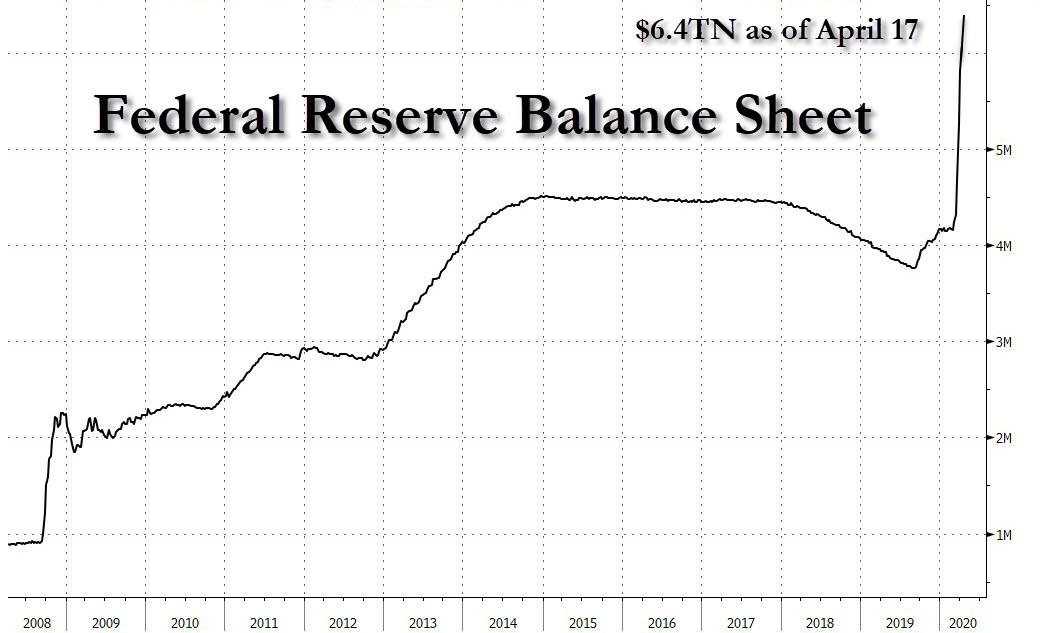
And here is an example of a curve that while some - namely the bears - also wants to see collapse, it will never do so as that would mean the end of western civilization - which is now entirely contingent on the level of the S&P500 - as we know it. We are talking of course, about the Fed balance sheet which is now well above $6 trillion to make sure stocks and bonds don't crash.
Fed Takes Sweeping New Steps to Provide Up to $2.3 Trillion in Loans
With that in mind here is all you need to know about this particular "curve":
Total Fed assets grew by $293Bn to $6.08 trillion as of close, April 8, with the increase primarily driven by $294bn of Treasury securities added to the SOMA portfolio. Through its credit facilities, the Fed also extended $680bn in temporary liquidity to various counterparties, a decline of $61bn from last week.
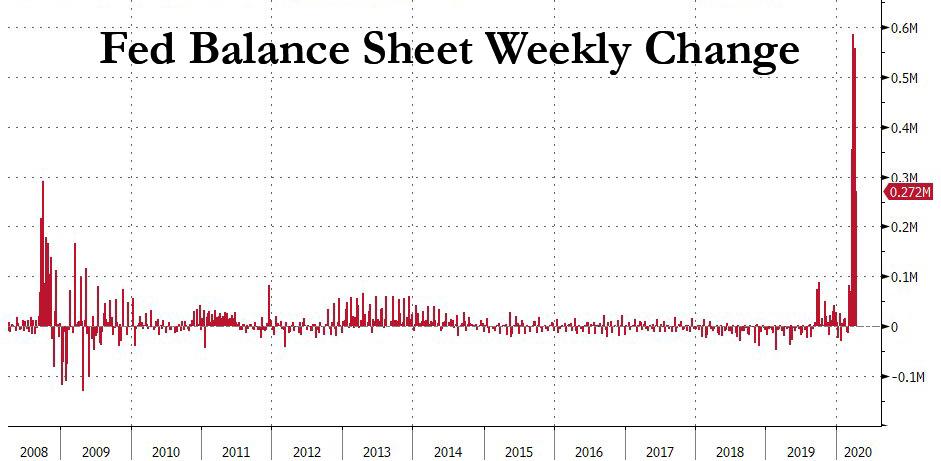
In the past month, the Fed balance sheet has increased by $2 trillion, more than all of QE3, when the balance sheet increased by $1.7 trillion over the span of a year. The balance sheet increase has also been faster on a weekly basis than anything observed during the financial crisis, increasing as follows:
- April 8: $$272BN
- April 1: $557BN
- March 25: $586BN
- March 17:$356BN
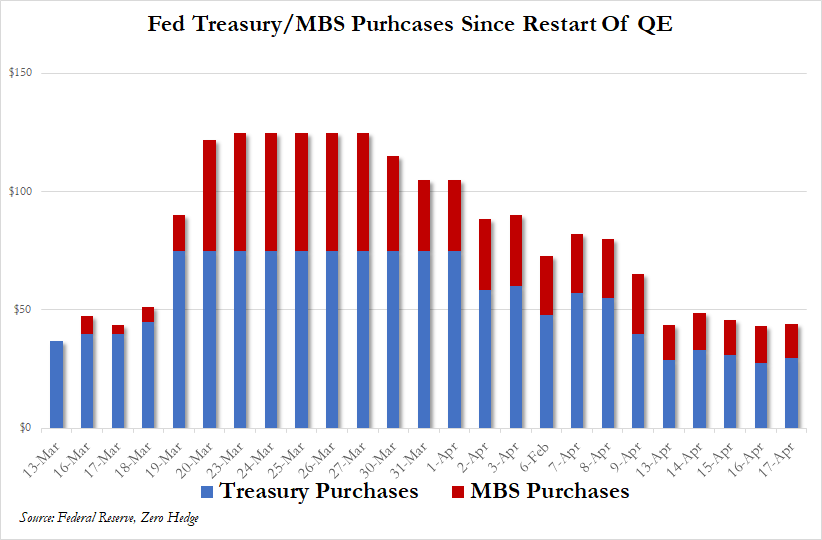
Since the Fed needs to monetize all debt issuance this year, and probably every other year now that the Treasury and Fed have merged and helicopter money has arrived, the pace of the current QE is like nothing ever observed before:
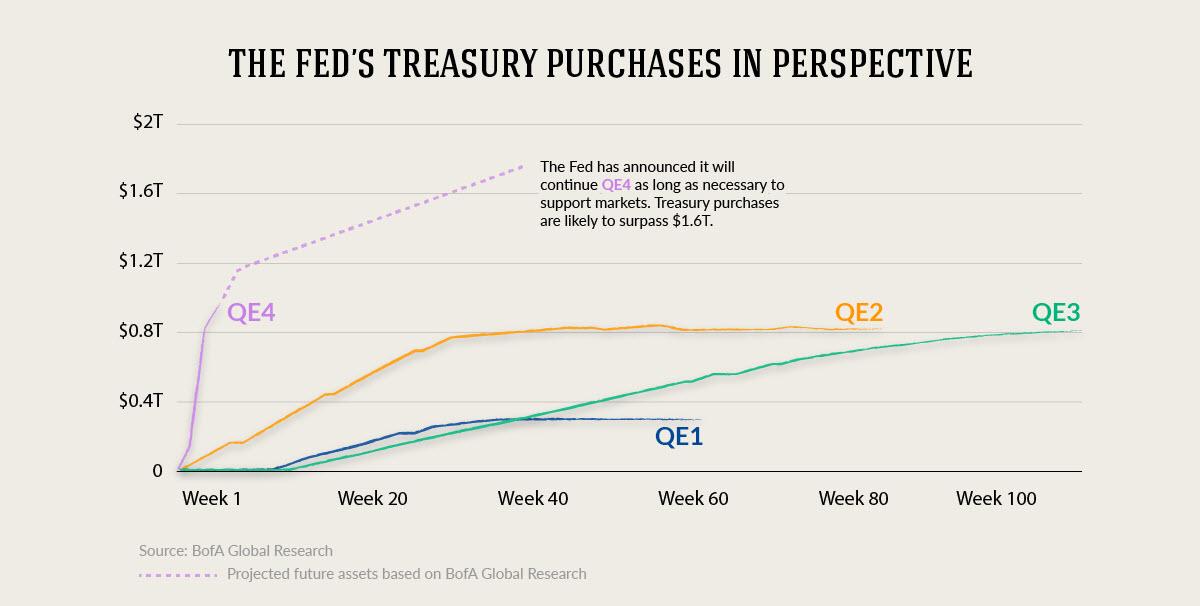
And since we know what the Fed's POMO schedule is for next week: an increase of $225BN in TSYs and MBS...

.. we can calculate that by next Friday, April 17, the Fed's assets will rise to at least $6.4 trillion, almost double where the balance sheet was in early September 2019, just before hedge funds needed to be bailed out and the Fed pretended like it was saving the repo market.
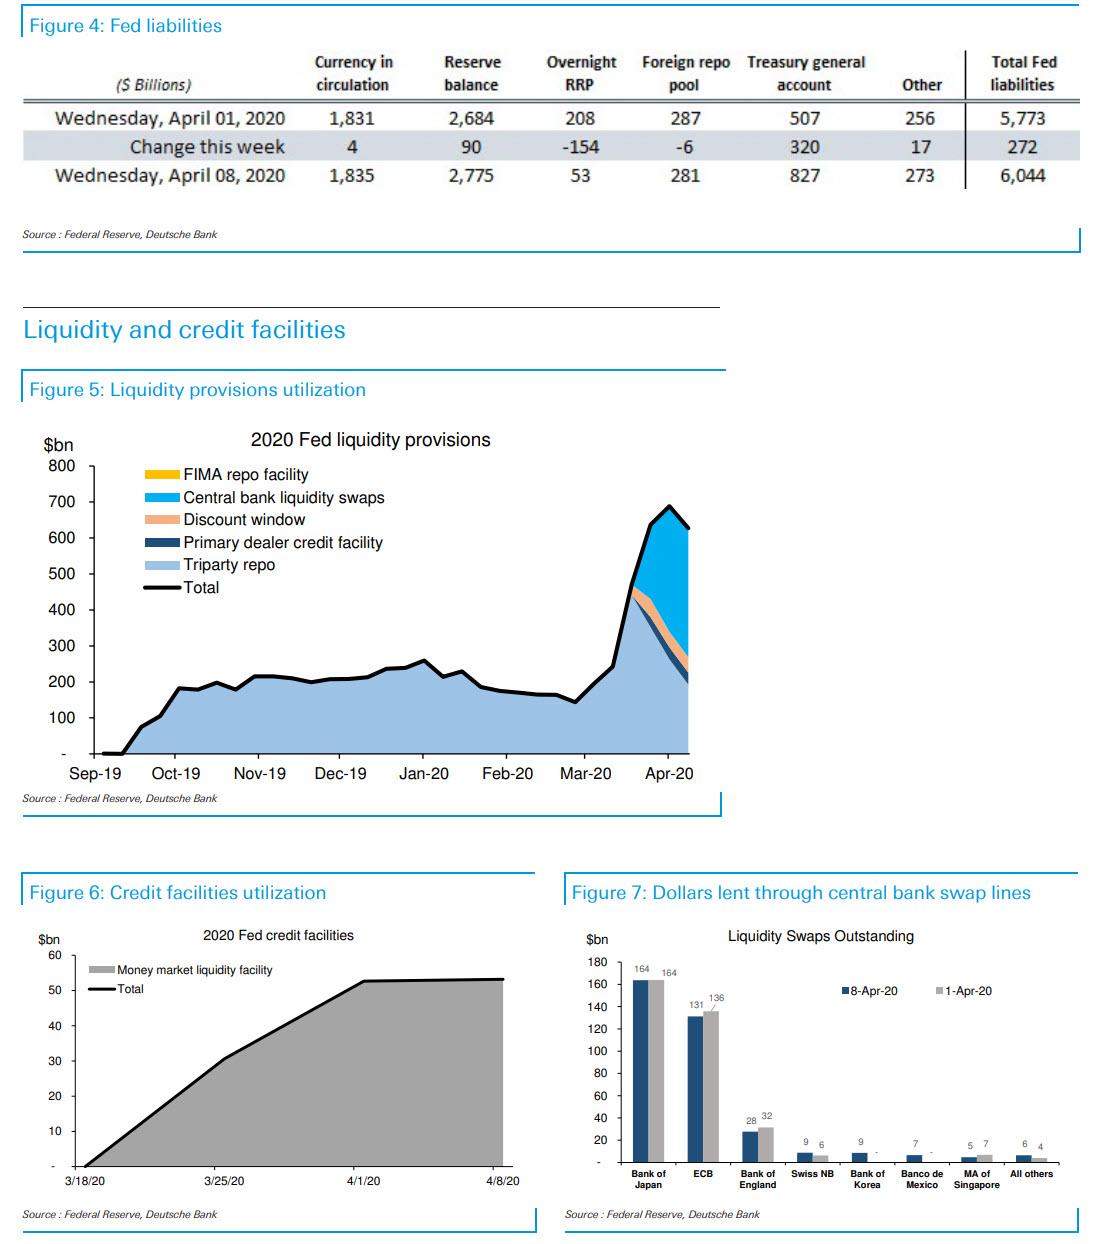
Some more details:
- The highest utilization among the Fed's credit facilities was the central bank liquidity swap lines, which saw its balances increase by $10bn to $358bn.
- Temporary repo operations with primary dealers fell by $70bn to $193bn. The newly introduced repo facility for foreign central banks had a balance of only $1mm.
- Balances in the Money Market Mutual Fund Liquidity Facility (MMLF) and the Fed discount window were relatively unchanged from last week with $53bn and $43bn, respectively.
Then, to make sure the balance sheet goes even more exponential soon, on Thursday, the Fed announced a new facility for municipal bonds and details for a number of other programs, including the Main Street Business Lending Program (MSBLP) and the corporate facilities. The two corporate credit facilities will receive a combined $75bn, allowing for a market footprint up to $750bn. Fed purchases will also include "fallen angels" and portions of syndicated loans. In addition, a portion of its ETF purchases in the Secondary Market Corporate Credit Facility will be allocated to high-yield ETFs.
In terms of the other facilities, the MSBLP will receive $75 billion of equity, allowing for Fed purchases of up to $600bn in loans.
Meanwhile, the newly established Municipal Liquidity Facility will offer up to $500bn of lending to states and municipalities backed by $35bn in funding from the Treasury.
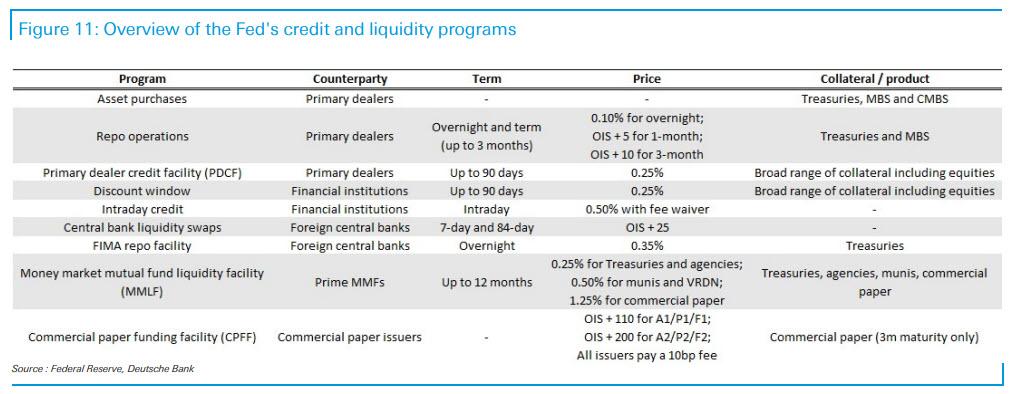
Here is a recap of all the Fed's various credit and liquiidty programs:

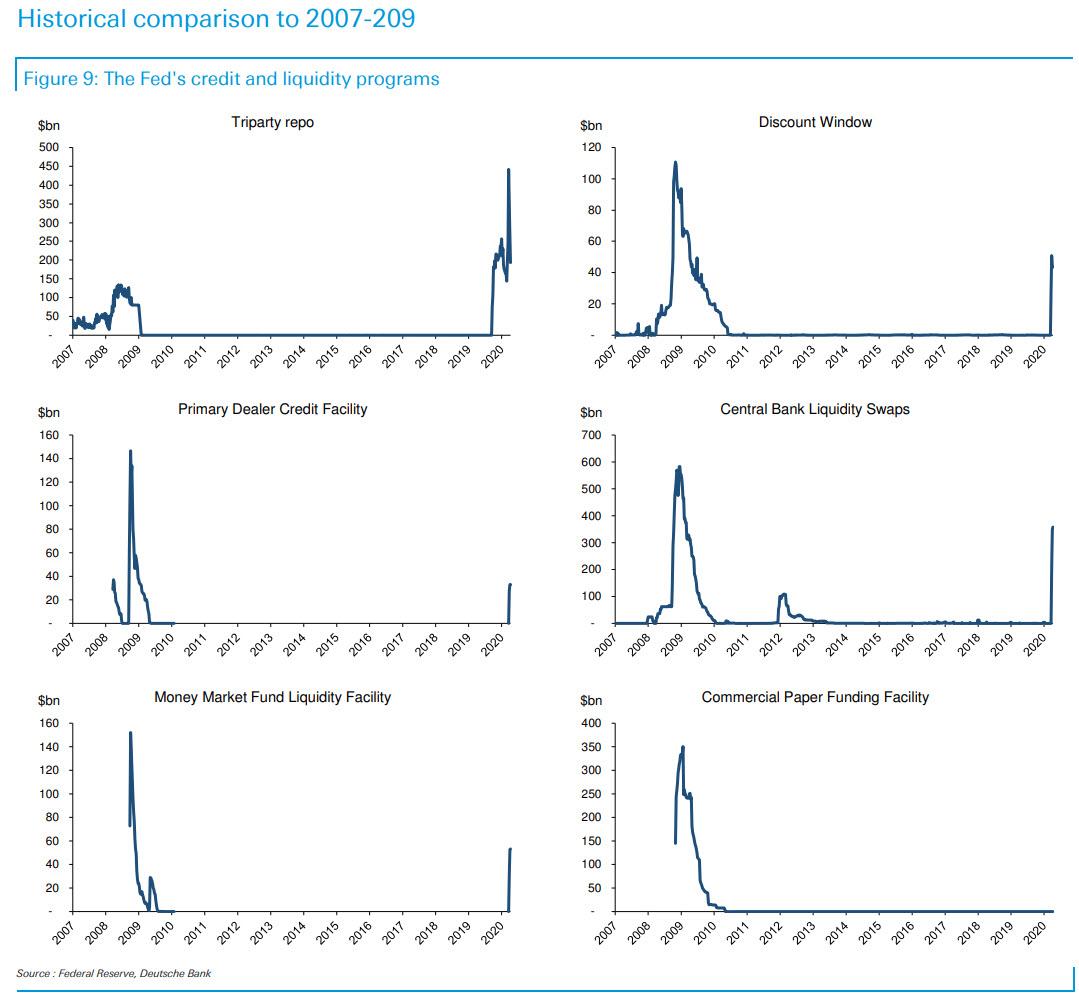
And finally, a comparison of how much the various liquidity programs are being used now vs 2008/9.

* * *
Commenti
Posta un commento