Visual Representation of the CCL Cap Structure...
Before discussing this malfeasance of capital structure management, let's rewind three decades.
Excluding brief periods of exuberance at the end of the 1920s and 1960s most public companies historically were staid organizations - they grew a few percent a year and paid out some of their profits in dividends. Boards of directors were mainly recruited from large shareholders who were more focused on sustainability than quarterly numbers or pushing the share price. Sure, there were outliers, there were guys doing crazy things, but a large portion of corporate America was focused on building long-term wealth for the large shareholders (often the families who controlled these businesses).
Then came Mike Milken and his cohort of extortioners and restructuring artists.
Don't get me wrong, by the 1980s, many US corporations had grown fat and a bit lazy—a good shake-up was needed, but the following generation of financial engineers took things too far. I'm all about improving returns on assets (ROA)—my gripe is that the focus then shifted to returns on equity (ROE).
Here's a simple exercise, take a mediocre business, add ten turns of leverage and then marvel at how amazing the returns to equity are. For the past generation, every corporate executive has undertaken a similar exercise and congratulated themselves on the results. For the holdouts who refused to lever up, there was a wolf-pack of hedge funds ready to pounce and educate them on why returning too much capital to shareholders was necessary. Is it any wonder that corporate balance sheets are such a mess today? Like a wounded gazelle, if your leverage ratios were low, you were pounced upon and told to lever up.
Coming out of the GFC, Boards of Directors tasked every CFO with a simple mission; figure out how much excess liquidity they'll need if there's another GFC that is 50% worse.
What does 50% worse mean? Who cares - CFOs built models and created numbers that were agreed upon. The models mostly looked at how deeply earnings could decline.
Not a single model looked at what would happen if revenue stopped. As a result, there was no rainy-day fund. There was no excess capital beyond a revolver that lasts only a few weeks at best.
What should have been excess cash reserves were squandered long ago on buybacks at all-time high multiples.
As we come out of this COVID-19 crisis, I suspect that Directors will demand larger liquidity buffers.
How much of a buffer? What if you need six months of op-ex in cash on the balance sheet? What if Directors demand Japan style balance sheets? What happens when you take leverage down at most corporations? You end up with middling ROEs and reduced valuations (like in Japan). I suspect that ROEs across corporate America are going to converge towards a new and much lower level. Think of the lesson from Carnival; if you spent a decade buying back stock and then dilute down 80%, have you created any value for anyone?
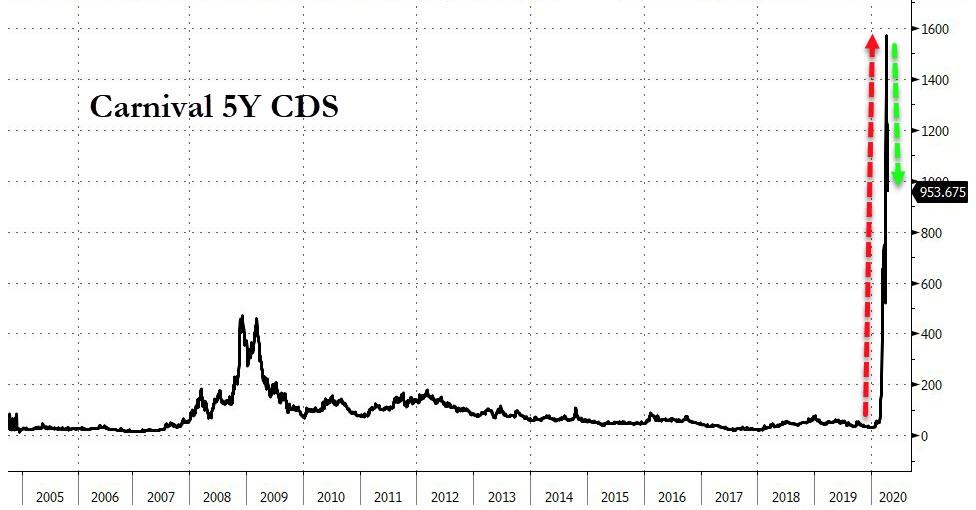
You think the Carnival execs will want to see their cost of capital do this again anytime soon? (note The Fed's HY bond rescue)
I think a lot of corporations are about to have some real soul searching after they undertake similar exercises. If you're a shareholder in an industry with terrible asset-level returns (think of your typical property REIT or pipeline MLP for instance), made palatable by high leverage, you may want to stop and think a bit about how the economics will look when leverage drops precipitously. You may be surprised at just how dramatically the ROE also declines. Conversely, industries that have been plagued by oversupply may now have a moment with reduced competition as companies focus on balance sheet repair instead of growth at any cost.
As the balance sheets of the world are reshaped, there will be winners and losers. You'd be foolish if you aren't thinking about how capital structure evolution will impact your portfolio. I guarantee you, as you are reading this, Boards of Directors are re-reading their D&O policies and then thinking deeply about the balance sheet...
Commenti
Posta un commento