Passa ai contenuti principali

US Industrial Production Crashes By Most Since End Of World War II

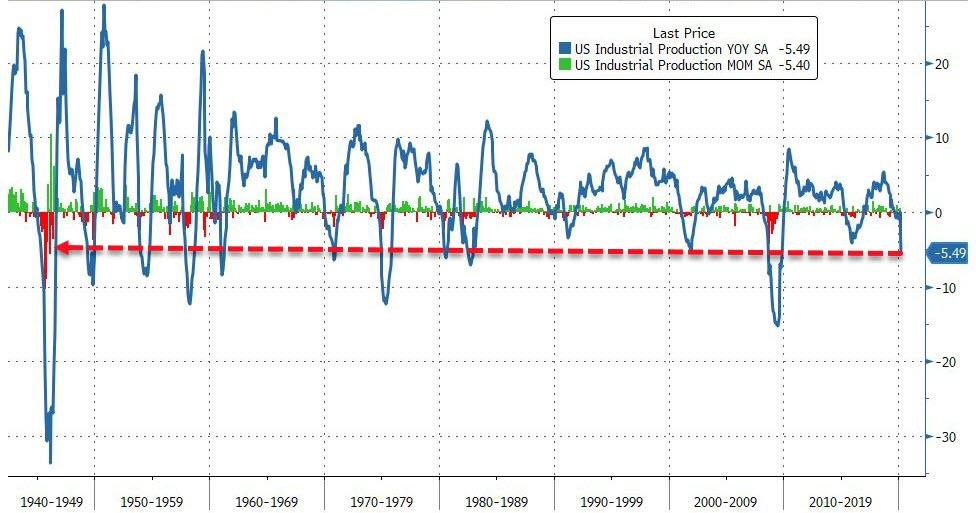
After surviving February (before COVID) with a modest MoM rise, US Industrial Production plunged 5.4% MoM (considerably worse than the 4.0% drop expected and the worst MoM since Jan 1946)...

Also, after briefly turning positive YoY in February, March Industrial Production is down 5.49% YoY - the worst YoY drop since Nov 2009
Source: Bloomberg

Best Uses For Stimulus Check

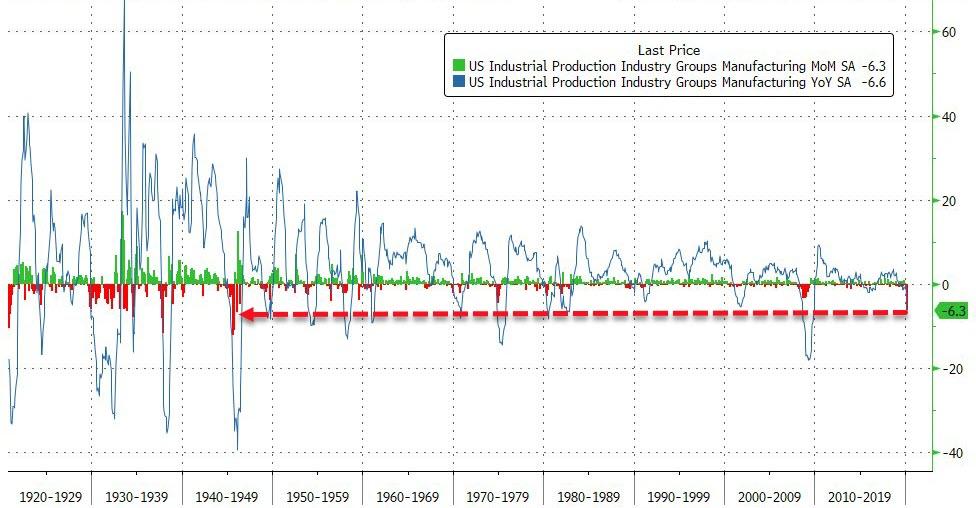
US Manufacturing production also collapsed, plunging 6.3% MoM and 6.6% YoY...
Source: Bloomberg

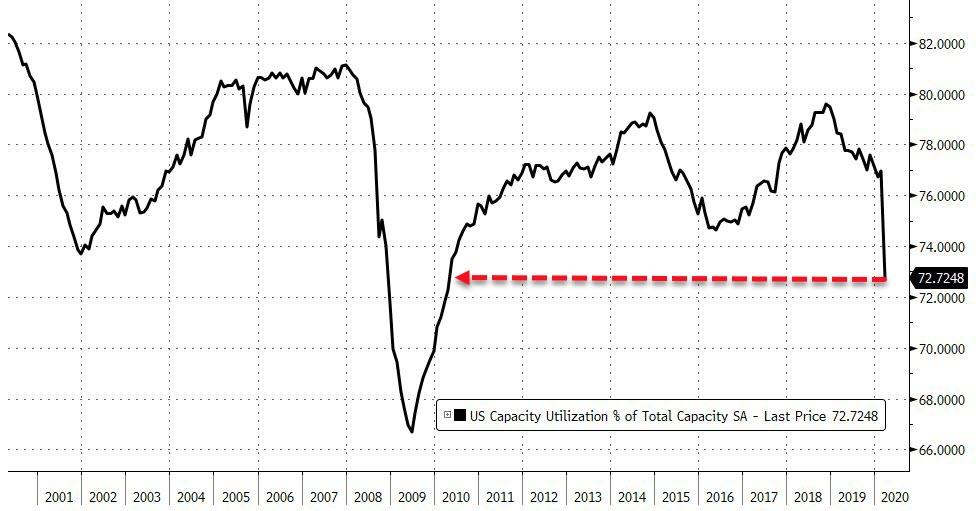
Capacity Utilization, not unexpectedly, collapsed to its lowest since April 2010 at 72.7%(against expectations of 74.0%)...
Source: Bloomberg

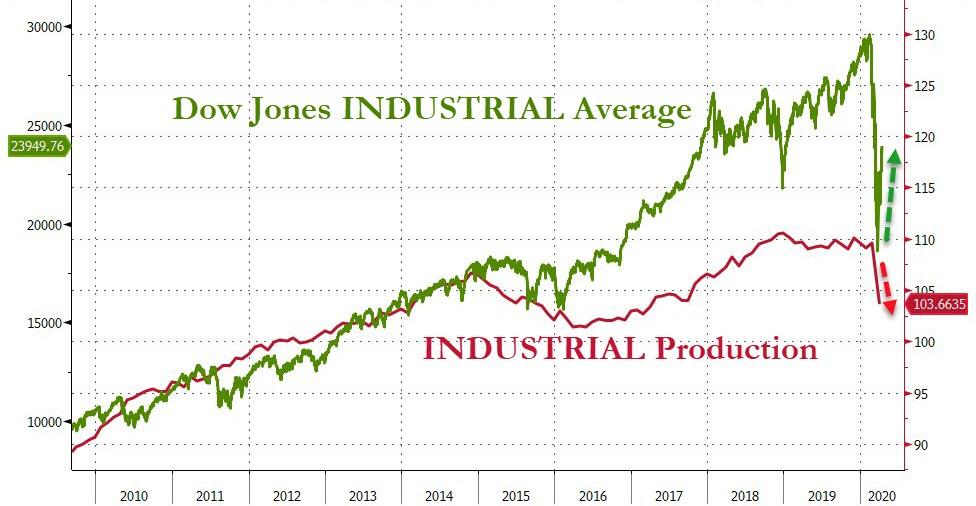
And finally, The Dow Jones INDUSTRIAL Average is finally caught down to the US INDUSTRIAL production level...
Source: Bloomberg

...but after March's drop in IP (and The Dow's Fed-floored bounce), The Dow still has a long way to go.

Commenti

Post popolari in questo blog

Charting the World Economy: The U.S. Jobs Market Is On Fire - Bloomberg

Charting the World Economy: The U.S. Jobs Market Is On Fire - Bloomberg https://www.bloomberg.com/news/articles/2019-12-06/charting-the-world-economy-the-u-s-jobs-market-is-on-fire Charting the World Economy: The U.S. Jobs Market Is On Fire Zoe Schneeweiss Explore what's moving the global economy in the new season of the Stephanomics podcast. Subscribe via  Apple Podcast , Spotify or  Pocket Cast . The last U.S. payrolls report of the decade was a doozy, beating expectations and doing its bit to keep the consumer in good health heading into 2020. That's good news given the various pressures still weighing on global growth. Here's some of the charts that appeared on Bloomberg this week, offering a pictorial insight into the latest developments in the global economy. U.S. Advertisement Scroll to continue with content ...

China Exports, Imports Fall Sequentially, Adding To Slowdown Fears

China's exports rose 19.3% y/y in July, missing the median consensus expectation of 20% (ranging from 15.4% to 30.7%), and declining sequentially -0.3% in July after rising +5.7% in June. Imports also rose less than expected, up 28.1% Y/Y in July, below the 33.3% median expectation, and fell 6.4% sequentially after surging +11.3% M/M in June. As a result this disproportional slowdown in imports vs exports, China's monthly trade surplus actually rose to $56.6bn in July, slightly better than the $53.3BN consensus, and up from $51.5BN in June due to the bigger miss in imports. ASEAN was China's biggest trading partner in July, followed by the Europe Union and the U.S., customs data showed. China's exports to the US grew 13.4% in July from a year ago, while imports from America rose 25.6%, leaving a trade surplus of $35.4 billion in the month. Some more details: By geography:  Export growth slowed across major export destinations, and exports to major DMs continued to be a ...