Passa ai contenuti principali

All T-Bills Up To 3 Months Now Have Negative Yields

 
There was something strange about today's continuation rally in stocks: while risk assets soared, the VIX barely moved. In fact the Vix is now roughly where it was on Monday, largely ignoring the move in stocks.
 

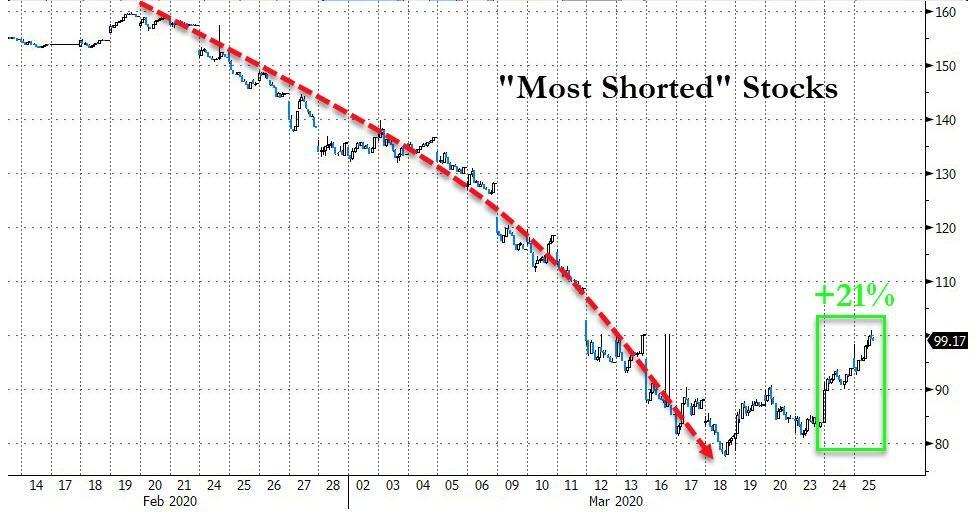
But there was another more sinister move in today's risk rally, which as we noted earlier, appears to have been mostly a massive short squeeze, in fact the biggest two-day short squeeze in history...
T-Mobile Launches $15 5G Plan
 

... namely the persistent buying of safe havens such as Treasurys but more importantly, Bills.

And so, one week after we reported that yields on many T-Bills through 3 months turned negative for the first time since the financial crisis, today virtually all Bills maturing around July had a negative yield.

Needless to say, a scramble for both cash-equivalents (i.e. Bills) and stocks is rather unorthofox, and sparked debate among Wall Street desks what may be behind it. One answer that emerged is that for those who did not have faith in today's stock rally and wanted to allocate their funds elsewhere, yet in the absence of available physical gold as a result of the unprecedented scarcity described yesterday, the one place where investors could find "cash equivalent" securities was among the short T-Bill maturities.

If this theory is correct, it would mean that the pent up demand for physical gold is unprecedented and any newly available precious metal will be quickly snapped up as soon as it is available, which in light of the unprecedented expansion in central bank balance sheets as virtually every state is now pursuing helicopter money, is hardly that surprising.


Commenti

Post popolari in questo blog

Charting the World Economy: The U.S. Jobs Market Is On Fire - Bloomberg

Charting the World Economy: The U.S. Jobs Market Is On Fire - Bloomberg https://www.bloomberg.com/news/articles/2019-12-06/charting-the-world-economy-the-u-s-jobs-market-is-on-fire Charting the World Economy: The U.S. Jobs Market Is On Fire Zoe Schneeweiss Explore what's moving the global economy in the new season of the Stephanomics podcast. Subscribe via  Apple Podcast , Spotify or  Pocket Cast . The last U.S. payrolls report of the decade was a doozy, beating expectations and doing its bit to keep the consumer in good health heading into 2020. That's good news given the various pressures still weighing on global growth. Here's some of the charts that appeared on Bloomberg this week, offering a pictorial insight into the latest developments in the global economy. U.S. Advertisement Scroll to continue with content ...

China Exports, Imports Fall Sequentially, Adding To Slowdown Fears

China's exports rose 19.3% y/y in July, missing the median consensus expectation of 20% (ranging from 15.4% to 30.7%), and declining sequentially -0.3% in July after rising +5.7% in June. Imports also rose less than expected, up 28.1% Y/Y in July, below the 33.3% median expectation, and fell 6.4% sequentially after surging +11.3% M/M in June. As a result this disproportional slowdown in imports vs exports, China's monthly trade surplus actually rose to $56.6bn in July, slightly better than the $53.3BN consensus, and up from $51.5BN in June due to the bigger miss in imports. ASEAN was China's biggest trading partner in July, followed by the Europe Union and the U.S., customs data showed. China's exports to the US grew 13.4% in July from a year ago, while imports from America rose 25.6%, leaving a trade surplus of $35.4 billion in the month. Some more details: By geography:  Export growth slowed across major export destinations, and exports to major DMs continued to be a ...