Passa ai contenuti principali

Stocks Suggest a Bottom is Forming: Five Charts Every Investor Needs to See Today

Disclaimer: I am not a scientist nor am I a healthcare official. I am not downplaying the Covid-19 situation; I am simply looking at what the markets are saying about the Covid-19 pandemic.

A very strange thing has started happening in the markets.

While the news continues to tell us that there is a global pandemic and that soon millions of people will be dead… the stock markets have begun bottoming.

The stock market in Italy, which is supposed to be completely imploding from Covid-19, bottomed on March 16th. It failed to make a new low and has yet to roll over again.

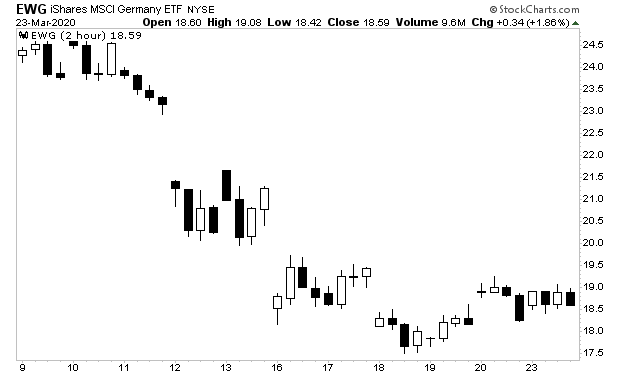
Germany, which is now experiencing its own Covid-19 issues, looks like it bottomed on October 18th. It is still touch and go here, but we have yet to see new lows.

Here in the U.S., multiple economic bellwethers are showing us something similar. 

Caterpillar is the largest producer of large machinery in the world. If the world was entering a depression, and things were worsening, CAT's stock actually bottomed on March 12th and is now putting in a higher low.

Similarly Freeport McMoran (FCX) is the largest copper producer in the U.S. Copper is a commodity that is closely linked to economic growth. And FCX's share price looks like it bottomed last week on March 19th. Despite yesterday's early morning bloodbath, FCX shares never broke to new lows.

Taken together, these charts are suggesting that the the market is in the process of bottoming. The one area of concern that has yet to give us the "all clear" is the credit markets.

Put another way, if that last chart begins to rally in a significant way, stocks could EXPLODE higher.

These charts are suggesting to us that the first round of the crisis, the deflationary collapse, will be ending sometime soon. But the second round, the INFLATIONARY storm triggered, by central banks printing trillions of dollars is just around the corner.

Commenti

Post popolari in questo blog

Charting the World Economy: The U.S. Jobs Market Is On Fire - Bloomberg

Charting the World Economy: The U.S. Jobs Market Is On Fire - Bloomberg https://www.bloomberg.com/news/articles/2019-12-06/charting-the-world-economy-the-u-s-jobs-market-is-on-fire Charting the World Economy: The U.S. Jobs Market Is On Fire Zoe Schneeweiss Explore what's moving the global economy in the new season of the Stephanomics podcast. Subscribe via  Apple Podcast , Spotify or  Pocket Cast . The last U.S. payrolls report of the decade was a doozy, beating expectations and doing its bit to keep the consumer in good health heading into 2020. That's good news given the various pressures still weighing on global growth. Here's some of the charts that appeared on Bloomberg this week, offering a pictorial insight into the latest developments in the global economy. U.S. Advertisement Scroll to continue with content ...

Another Paradox: Consumer Spending Expectations Surge, Despite Dismal Income, Earnings

Call it the latest economic paradox. Despite widespread stories of doom and gloom about the state of US consumer finances once the fiscal stimulus bill expires on Dec 31, the latest NY Fed survey of consumer expectations unexpectedly shows that US consumers have little intention of slowing down their spending. In fact, and very paradoxically,  despite depressed and flat income and earnings growth expectations,  with median one-year ahead expected earnings growth at 2.0% for fifth consecutive month and expected income growth barely little changed at 2.14% ... ...  consumers' 1-year ahead  spending growth expectations  jumped to 3.73% over the next 12 months in November  - the highest level in more than four years, not only up from the 3.06% in the previous month but a whopping 33% more than the 2.8% reported last November,  making this the biggest Y/Y increase in expected spending in series history. This bizarre increase took place even as labor market signals were mixed: although t...

China Exports, Imports Fall Sequentially, Adding To Slowdown Fears

China's exports rose 19.3% y/y in July, missing the median consensus expectation of 20% (ranging from 15.4% to 30.7%), and declining sequentially -0.3% in July after rising +5.7% in June. Imports also rose less than expected, up 28.1% Y/Y in July, below the 33.3% median expectation, and fell 6.4% sequentially after surging +11.3% M/M in June. As a result this disproportional slowdown in imports vs exports, China's monthly trade surplus actually rose to $56.6bn in July, slightly better than the $53.3BN consensus, and up from $51.5BN in June due to the bigger miss in imports. ASEAN was China's biggest trading partner in July, followed by the Europe Union and the U.S., customs data showed. China's exports to the US grew 13.4% in July from a year ago, while imports from America rose 25.6%, leaving a trade surplus of $35.4 billion in the month. Some more details: By geography:  Export growth slowed across major export destinations, and exports to major DMs continued to be a ...